How does this 2 day rally compare to the historical average?
The 2 day rally that started December 16th of this year seemed unusually robust and euphoric - rocketing from a low (close) of 1972.74 to a whopping 2061.23 by the 18th - that's 4.49%.
I had already been running a bit of numbers in response to the "Bullard rally" in October, so I tweaked things a bit to see if I could see the context of the Dec 16-18 move relative to other big rallies in the S&P 500 throughout history.
Now, a huge warning about this post and its findings - I do NOT have a Bloomberg terminal, so all of the data crunching I've done here has been by hand. Exporting the daily pricing data into an excel spreadsheet, calculating the 2 day returns, ranking them - etc. It's been fun, but there may be bone headed errors, even though I've tried my best to be as accurate as possible.
After ranking all of the 2 day rallies going back as far as I could (1928) - I found the Great Depression was providing way too much noise. So I thought I'd look at the data from January 2nd, 1940 to December 2014.
When I did that, some interesting things happened.
A - I found that the 4.49% rally we saw from December 16th to 18th was indeed noteworthy as it ranked as the 89th largest rally out of 18,853 2 day rallies in the data set. Not bad given a three sigma move is 5.05%.
B - I also noticed a tremendous cluster of similar dates on the other top rallies - 2008, 2000, 1998, 1973, 1982, etc
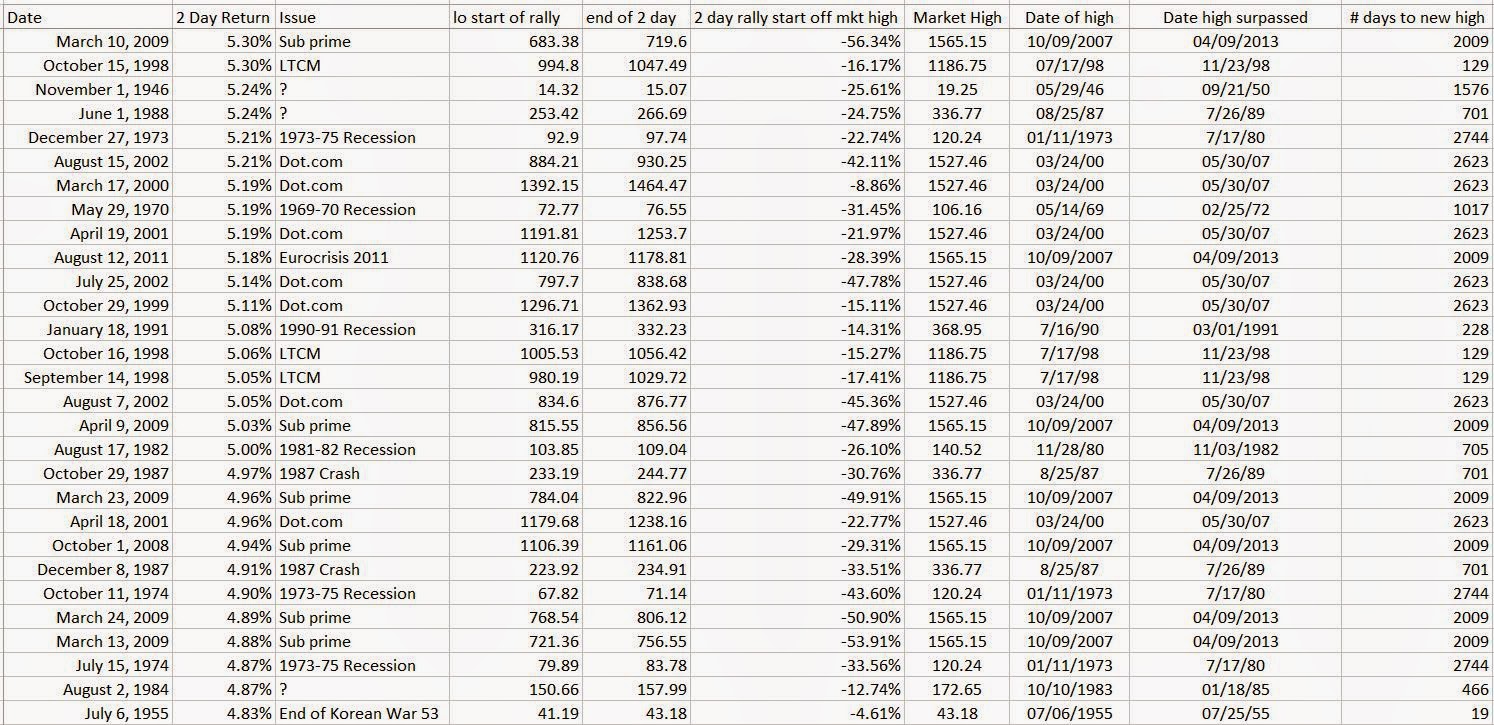
So, after ranking the top 100 2 day rallies back to 1940, I was able to categorize them into the following 12 events -
1. The 1987 Crash (Oct 19th, 1987)
2. The Sub-Prime Crisis
3. The Dot.com bubble
4. The 1973 - 1975 Recession
5. The 1981-82 Recession
6. The European Crisis of 2011
7. The 1990-91 Recession
8. The 1969-70 Recession
9. The Asian Flu
10. The LTCM Crisis
11. Various dates associated with war outbreaks
12. an "Unknown" classification - requires more research on the significance of each day
The date ranges I used for each particular crisis or event was the relative high as the start date, and the low as the end date. I did strip out the high market value reached before the Great Depression because the 31.86 high reached in 1929 wasn't recovered until 1954.
Doing this resulted in the following breakdown -
So, apart from the 14 days listed in the "unknown" category (which is more a function of me needing to do a bit more research than anything else) and the Dec 16-18th rally, 85% of the 2 day rallies between January 1940 and December 2014 occurred during a time of financial crisis, bubble chaos, recession or time of war. I found that very striking given the December 16-18th rally happened absent any of those markers.
The other question I had about the history or tendencies of huge 2 day rallies related to how they compared to the previous high. My guess was that many (or most) of these unusually large 2 day rallies would occur after a significant correction or pullback from a previous high. SO once again I did a bit of digging through the data.
I found the larger (ie top 100 2 day rallies) occurred only after the markets had corrected on average by 30%. The smallest correction (3.59%) and outlier 2 day rally of 5.46% occurred in November 1982, during the 1980-81 recession. But, it took 705 days to surge past the previous market high. The December 16-18 4.49% rally occurred after a 4.95% correction but only took 7 days to surpass the previous record high. This is unusual given the average number of days to surpass the previous record high is 1637 days.
While this breakdown doesn't provide any information that will help you with a trade, it does put the December 16-18 2 day rally of 4.49% into context. Given the rally occurred absent a recession, crisis, bubble or time of war - the magnitude of the rise is VERY unusual and should not be treated as 'normal' or "not noteworthy" -
A breakdown of the top 100 2 day rallies is snapped below for your interest - again, given this was all done by hand, there may indeed be some errors.. but I've tried to be as thorough as possible. If you notice an error please let me know and I will update my spreadsheet. Or, if you are able to track down any of the "unknown" events let me know..
If you find this information useful GREAT!! If you reproduce it, post it, etc.. please do me a favor and provide attribution. I don't post much but it would be nice to get some credit if you find the material interesting.
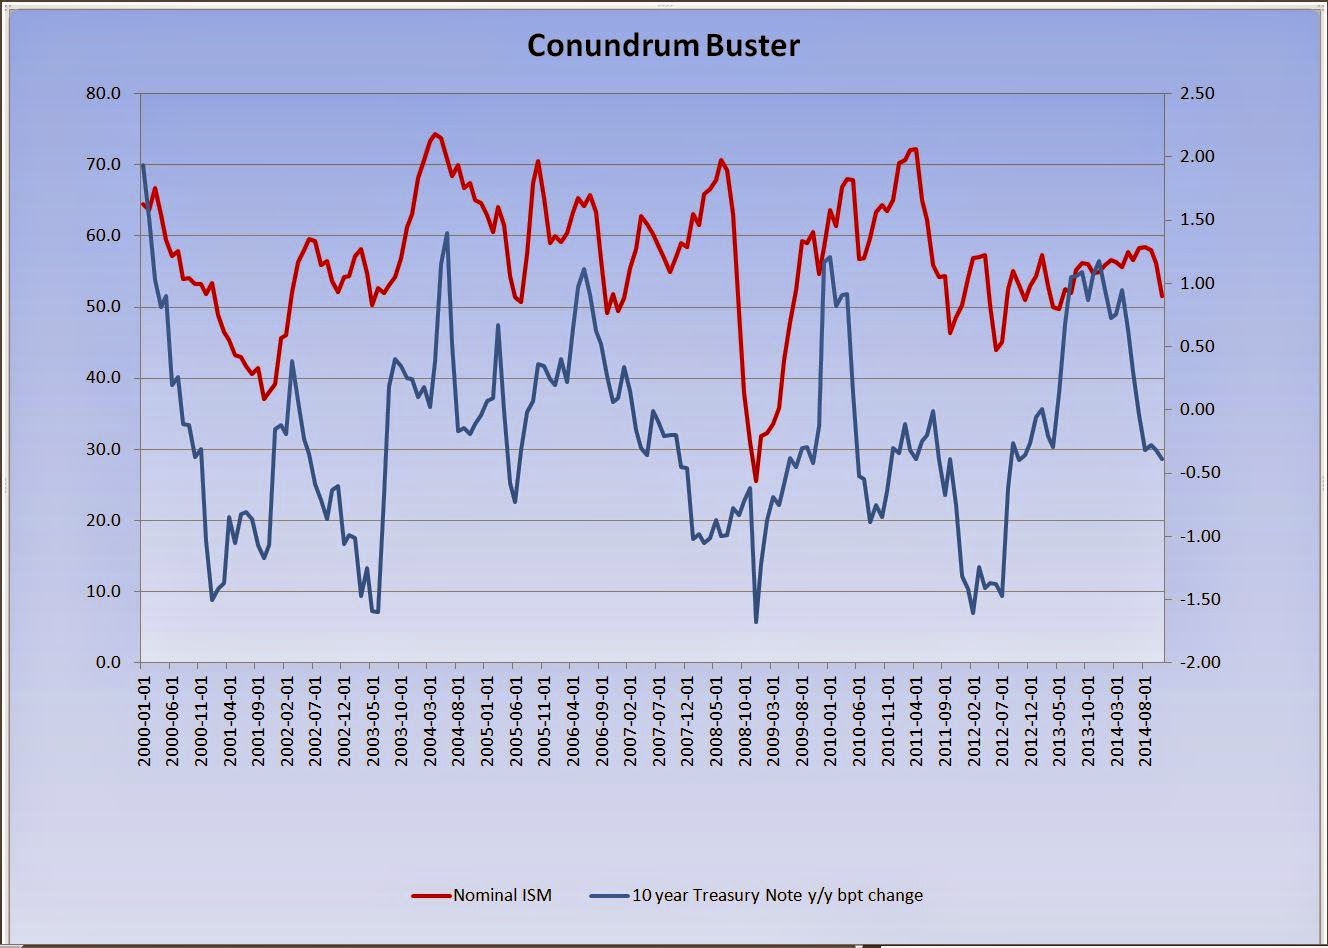
As you know I do a fair bit of bonds for my retail clients, so this piece was very interesting to me.. so - I set about to recreate Paul's work..
First, to make sure I had the right idea - I recreated Paul's graph from 1983 to 2005, just to make sure it looked similar.
not bad..
and then, I went off and applied the same set of rules to today's market. I've done this a few times (after the taper tantrum for example.. to check and see what I was missing) -
here's where we are today -
so to me, this continues to flash the "all clear" on rates. As such I don't think you will see rates rise because of fundamentals. We could however see a rate bump as per Gundlach's suggestions - but I doubt it would be much, or meaningful.. as the data just doesn't support a move higher at this point.
I'll say it until I am blue in the face.. I am NOT smart. I was never a kid who got A's in school, no matter how hard I tried or studied. I think one of my best qualities as a person who works in the financial industry is that I am very curious. I want to understand how things work to the best of my ability. While some are happy to just bob along like a cork in the big market, taking the returns that are given to them - that isn't okay with me. I want to UNDERSTAND the machine so that I have a very good idea of where these returns come from.
If you've been reading me here, or via my twitter account you know I have some major concerns about the market. To save time I won't rehash all of that here, but suffice it to say I don't think all is well out there.
Anyhow - John Hussman recently posted a fantastic chart that I think really put things into perspective - it was in his Weekly commentary from September 8th
here's the chart -
I've seen a lot of charts over the years, but nothing screams "umm.. what?" more than this one. But given my natural inquisitive nature.. I wanted to take a deeper look at this chart to see if there was anything noteworthy under the surface. I mean the run on the S&P 500 from 2009 to today 'could be' justified if earnings, incomes, jobs and GDP growth was running at all time highs.
So I went to the best website on the planet for anything related to US macroeconomics FRED and pulled off the quarterly stats for GDP, Personal Consumption Expenditures and Corporate profits. I then hit Professor Shiller's website to snag the S&P 500 data along with the CAPE info.
Once it was all put into excel - I just created a base index using the respective starts of the bull markets to the nearest quarter (January 1995 to April 2000, January 2003 to October 2007 and April 2009 to present)
and came up with this (1995 bull for example).
I guess some will argue I should use different numbers, or a different base - or that GDP, PCE, EPS and CAPE figures don't matter.. and maybe that's true. It seems that economic fundamentals mean nothing these days.. but I have a very hard time thinking that they don't matter "anymore".
here's 2003-2007
and 2009 to 2014
Nothing screamingly obvious here.. but interesting to me none the less.
Here was the summary of each bull market's growth in the various components
and then I added it to Hussman's original chart..
It would be interesting to tear into the EPS data a bit more given the massive increase in share buybacks, and I'm sure there are all sorts of other data points that we could look at in addition to the ones I've picked here. I didn't try to cherry pick anything - instead just wanted to see if there was any major 'thing' that stood out. It does look like GDP and PCE are quite a bit lower than previous bull runs - but who knows.
Anyhow informative or not.. it was fun to play around here. I hope it inspires someone else to dig into this stuff in a bit more detail. Of course you know I tend to be leaning pretty significantly towards this market being a rather large bubble.. but obviously have no idea if or when it will pop.
The Stockdale Paradox is named after Admiral James B. Stockdale, who was the highest ranking US Military officer imprisoned in Vietnam during the war. Stockdale was shot down while flying a mission over North Vietnam on September 9th, 1965 and taken immediately to the infamous Hoa Lo prison, also known as "The Hanoi Hilton". Stockdale was a "prisoner of war" and 'lived' there for the next seven and a half years.
In the summer of 1969, he was locked in leg irons in a bath stall and routinely tortured and beaten. When told by his captors that he was to be paraded in public, Stockdale slit his scalp with a razor to purposely disfigure himself so that his captors could not use him as propaganda. When they covered his head with a hat, he beat himself with a stool until his face was swollen beyond recognition. When Stockdale was discovered with information that could implicate his friends' "black activities", he slit his wrists so they could not torture him into confession. Stockdale was released as a prisoner of war on February 12, 1973
Year later, author James C. Collins was interviewing Stockdale about his time at the Hanoi Hilton for a book called "Good to Great" - during the interview, Stockdale explained how he managed to survive all those years as a POW. He said,
"I never lost faith in the end of the story, I never doubted not only that I would get out, but also that I would prevail in the end and turn the experience into the defining event of my life, which, in retrospect, I would not trade."
Collins followed up by asking Stockdale who didn't make it out of Vietnam alive. Stockdale replied,
"Oh, that's easy, the optimists. Oh, they were the ones who said, 'We're going to be out by Christmas.' And Christmas would come, and Christmas would go. Then they'd say, 'We're going to be out by Easter.' And Easter would come, and Easter would go. And then Thanksgiving, and then it would be Christmas again. And they died of a broken heart."
Stockdale then added, "This is a very important lesson. You must never confuse faith that you will prevail in the end—which you can never afford to lose—with the discipline to confront the most brutal facts of your current reality, whatever they might be."
It was this philosophy of duality, that inspired Collins to describe it as the Stockdale Paradox.
Why am I writing about this rather dark and depressing paradox this month?
Well as I am sure you have figured out by now, I think it does a wonderful job of explaining how I am wired as a Portfolio Manager. While my letters over the years may sound dire and dark, the truth of the matter is that I have great hope and excitement about our future. I have faith that we will see through these difficult times, and get back to less chaotic days. But, as with Stockdale, I also possess the discipline to confront the most brutal facts of our current reality.
It was this discipline that enabled me (as you know) to completely avoid the dot.com bust in 2000, as well as the Great Financial Crisis of 2008/09, even as many in the industry ere busy assuring investors that "all was well" - .
Of course we know both of the statements above turned out to be spectacularly incorrect, and led to massive losses by investors.
Now, in 2014 the stock market has hit all time record highs as expectations that the US economy is approaching "escape velocity" - but, my discipline and macroeconomic research believes this is yet another naively optimistic narrative.
To borrow the paradox above, the US stock market has been saying they will see escape velocity by Thanksgiving, then Christmas, then New Years, then Easter.. Those of us who have been keeping track know that they've been saying this for the last 5 years.
Confronting the brutal facts about our current economic situation tells us that while things are certainly better than they were in January or February 2009, they are a very long ways away from anything that could be construed as "Escape velocity". As such, the longer true "escape velocity" eludes the US economy, the stock market as with those unfortunate souls who did not make it out of the Hanoi Hilton, run a massive risk of dying from a broken heart.
Just something to consider.
* a h/t to Zerohedge. While I was very familiar with the story of James Stockdale's torture, I had forgotten about the paradox - something they mentioned in two fantastic posts here and here. I wrote something similar not to try and pretend this was my original idea, but to record these thoughts on my own blog for future reference.
I should preface this - and all of my posts for that matter - by saying that my scope and experience is purely on the retail advisory side. I've never worked in straight banking, nor on the institutional side and I don't have a CFA and am certainly NOT an equity analyst. I started straight out of University in 1993 and everything I know today I've picked up along the way.
I run individual investment portfolios - I manage the investments of your Mom or Dad, your Grandparents, or your Aunts and Uncles. I don't do futures or currencies and stick to running mostly vanilla stocks and bonds.
The more I read about how some people trade via twitter, the more I realize that my specific portion of the investment world is basically the phytoplankton of finance. We are small and individually insignificant but do play a big part in supporting the bigger financial ecosystem. Bigger players have other terms for us, "muppets" comes to mind.. which is fair enough, so call me Gonzo.
I will concede that perhaps the observations I make, as a small phyto-financial plankton don't mean a hill of beans to the bigger ecosystem. But if I do say so myself I think I have developed a bit of a knack for identifying problem areas before they occur.
Yes I admit it freely - I'm wired to worry.
I am more often than not inclined to take the safer road and the cautious approach than to seek out risk. Personally think you kind of need this mindset if you want to work in retail and manage "Other People's Money".
I mentioned the problem that I have with analysts getting "lazy" with their target prices and advice on stocks in "Charles Neuhauser meets the Asch Paradigm" - in today's market I am seeing a TON of target prices getting bumped up even as earnings estimates fall. Paying 24x next year's estimated earnings on a stock whose longer term eps growth rate averages 4 or 5% is just asking for trouble.. but, many ignore the rules.
AH well.
I'm seeing so many target prices being bumped up a few dollars via an expanded multiple assumption rather than any higher assumed earnings - just so analysts don't have to answer the question of why the stock isn't a sell.
It's that Keynesian career risk thing - you don't want to put a sell recommendation on a stock only to have it keep rolling higher on you.. client's don't dig that.
But you know what? An expensive stock is an expensive stock.. and call me naive but if you are simply slapping an additional 1.5x multiple on an ALREADY LOFTY forward PE.. just because the momentum of the stock continues to be higher.. what sort of value are you adding to the portfolio?
Also - given earnings growth and fundamentals are clearly NOT driving the share price.. how on earth are you going to know when to get the hell out of the way?
I find too many just accept the upside without paying too much attention to the fine print (or lack thereof).
Stock is moving through your target price? Well then take a look at your model and see if you are missing anything that could explain the action.. more growth coming from somewhere you didn't anticipate? Are your earnings expectations too conservative? But for god's sake don't just look at the street consensus and slap another 1.5x on so you can increase your target price by $5.00..
Clients pay us a lot of money to work diligently on their behalf.. if a stock is expensive.. it's expensive.. if it has a target price of $50.00 and it's trading at $56.00 with no new catalysts to push your earnings estimates higher.. you need to at LEAST do the math to see if you should ease the size of the position down.
If I'm running my own funds then it doesn't matter - but the last thing in the world you want to do is be overly optimistic on a stock or market with client money..
Most in retail tend to be fairly heavy in equity anyhow (some I know are basically 100% in stock.. holy crap..) - so if they are WRONG on the recovery and the bull market.. they don't get hurt.. but man, do the clients get smoked.
Just a small rant.. I saw about four 'increased target prices' using the same cheeky pe expansion (even as estimated earnings were REDUCED!!!)
Somewhere, Charles Neuhauser is shaking his head and waiting to say
"Worldly wisdom teaches that it is better for reputation to fail conventionally than to succeed unconventionally"
John Maynard Keynes - "The General Theory of Employment, Interest and Money"
As a retail portfolio manager who runs individual investment accounts, words can't describe how much I dislike the quote above. To me it's a cop out - it's lazy, ill advised and ultimately ends up hurting clients.
Is it really better for one's career to be wrong along with the majority than it is to stick to a well thought out long term strategy that may be 'out of favor' or unappreciated at the moment?
To me, Keynes seems to be endorsing a kind of "Blind Lemming" approach to investing. The sweet irony here is that the whole lemming "mass suicide" thing is a myth that has been perpetuated by humans for eons. Of course reality follows logic: No, lemmings aren't dumb enough to blindly follow the masses off a cliff "just because everyone else is doing it". Unfortunately, many in the financial industry didn't get the "lemming myth" memo and instead have invested (their client's money) heavily in the myth.
Sure, career risk is very real and something that all of us have to be aware of - but does that mean we need to blindly follow or invest in something that we don't believe or understand, just so we can conform with the majority?
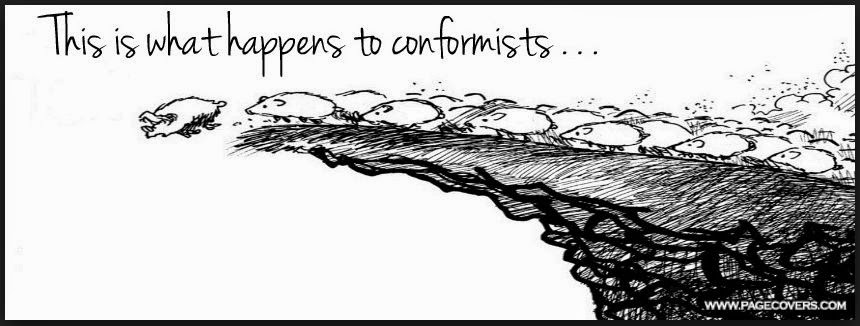
"The opposite for courage is not cowardice, it is conformity. Even a dead fish can go with the flow"
Jim Hightower
said another way
The Keynesian lemming model can be found everywhere in the financial industry. Sure, it's not CALLED the Lemming model - because that would raise red flags. Instead the Lemming model for finance has been subtly hidden in pithy, bold, and well-known investment mantras such as:
"Don't fight the Fed"
and
"The Trend is your Friend".
"Don't fight the Fed" is considered good investment advice? Really?
Are we talking about the same Fed that had a hand in creating the dot.com bubble, the housing bubble, and the financial crisis of 2007/09 (to name a few)?
If it is - then why in the hell would you ever want to hook your wagon to their track record?
Forget the Fed for a moment. Instead assume there was a pilot who had a history of acting irresponsibly. Over the last 15 years, this pilot's irresponsible actions led to him to crash his plane twice, causing untold damage, death and pain. If we follow the same "Don't fight the Fed" logic, I should be seeking out said pilot when I choose to travel, and be happy and excited about flying with him. Does that make sense?
Assuming the irresponsible pilot doesn't recognize that he has a problem, and therefore doesn't change his ways - what is the likelihood of us being involved in another crash?
Following the same thought process then - if the Fed doesn't recognize that it has a problem, and therefore doesn't change it's approach - what is the likelihood of another Fed induced crisis/crash?
Sure, maybe it's a few years down the road.. but my point here is don't mindlessly "go with the flow" simply because everyone else is doing it.
If you are going to invest - have a model, have a method, have a discipline.
The best, NON-Lemming quote I've seen in a while is this:
"I would rather lose half of our clients, than half our client's money"
Jean Marie Eveillard
Perhaps this issue doesn't apply with the institutional side, or for people who simply trade their own capital - but for running other people's money - it's absolutely KEY.
The last thing in the world anyone on the retail side wants to do (assuming they care about their client's well being, and aren't a sociopath) is blow up a client's financial future simply because they were "following the masses" in an effort to not look stupid. To me there is nothing more intellectually dishonest than sending out a "There was no way to have seen this coming" letter to try and explain what went wrong AFTER blowing up a client's account on a correction that they should have seen coming. The DOT.COM and 2007/09 corrections are PERFECT examples of situations where a broker 'should' have seen it coming - I mean really.. it wasn't rocket science.
Unfortunately today, I am seeing a LOT of complacency on the retail side of the business. Too many brokers walking around thinking the returns they are earning is because of their own brand of genius rather than the plethora of financial morphine sloshing around in the system. I've overheard "It's almost too easy" and "it's like shooting fish in a barrel" far too many times for my liking - just as I did in '98, '00 and '07.
While many may assume I am a 'perma-bear' I can tell you I am not - I am a realist. If and when the investment environment changes, my views will change. Unfortunately from where I sit, nothing has really changed. The problems, flaws and abuses continue to exist and there seems to be no desire to change the approach or come up with a workable solution. This is something I've been saying since 2009, although I have noticed more and more people are starting to suggest the same thing - (Maximillian Zimmerer, CIO of Allianz SE recently said "The fundamental problems are not solved and everyone knows it")
So what to do?
All I suggest is that investors be keenly aware that many of those bold and courageous quips we keep hearing from CNBC and the TV gurus aren't calls to be wise. Instead they are fluffy, ill thought out calls to conform to the Lemming Mentality. It's a call not to think - but to just mindlessly go with the flow.
So, when someone gives you a little investment advice such as:
"The Trend is your friend" "Stocks always outperform over the long term" "Stocks are the only game in town"
"The market can stay irrational longer than you can stay solvent"
"Don't fight the Fed"
"The economy isn't the stock market"
"The consumer doesn't matter"
"Earnings/Sales/GDP/Wages doesn't matter"
"It's a whole new paradigm" "The cleanest dirty shirt.."
and
"This time it's different"
know what they are really suggesting is this -
Yes - Maybe it will take a while for reality to hit, for the mean to revert or for fundamentals to matter again.. but at some point they will - because they always do. All I'm suggesting is that if you run money on behalf of someone else, that you be keenly aware of Keynes' endorsement of the lemming myth.
"Never overpay for stock. More money is lost than in any other way by projecting above-average growth and paying an extra multiple for it"
Charles Neuhauser, Bear Stearns
This has always been one of my favorite quotes, and I think it's one of the most relevant thoughts I've ever come across. Of course these days, valuation and fundamentals have been thrown into the back seat as other factors are currently influencing the market's direction. But, valuation - what you pay for the companies you buy - is always important. No matter what is going on in the short to medium term.
With that in mind, I wanted to give an example of what I'm struggling with regarding current stock valuations, and then tie that into Asch's paradigm in an effort to show how the financial industry gets itself into trouble from time to time.
So I thought I'd pick a company whose business I like, but am wary of the valuation. A name that everyone knows, and that has a great global brand: Proctor & Gamble (NYSE: PG). I like the company because of it's incredible stability. It's paid a dividend every year since 1890, and has raised its dividend for 58 years in a row. The company boasts an incredible brand - selling products under the names Tide, Gillette, Pampers and Crest.
So a quick look at Valueline shows 2014 actual earnings were $4.05 - which suggests PG trades at 19.94x 'trailing earnings' -
Sidenote: See, way way back when I started in the business (1993) all PE ratios were based on trailing earnings, as those were the earnings actually earned and recorded into the books. The 'forward earnings' references started a few years after I started. Initially research pieces quoted forward earnings only going out a year into the future, but as the practice took root, it's now not unusual to see estimates going out three years. We will get back to this on the second part of the discussion.
If the earnings for PG in 2014 are expected to come in at $4.30, and 2015 at $4.60, then PG is said to be trading at 18.79x 2014e EPS and 17.56x 2015e EPS. See? Doesn't the idea of paying 17.56x to buy PG sound so much better and more reasonable than buying it at 19.94x?
Now, here is where Neuhauser's comments come into play.
An increase in earnings from $4.05 to $4.30 is 6.17%, and an increase from $4.30 to $4.60 is 6.97%. In its most simple form, value investing is when you are buying a company at a cheap price relative to its earnings growth rate. Using a PEG ratio measure (a ratio of PE ratio divided by a company's earnings growth rate) the goal is to buy a company under 1.00 - that is, you are buying a company whose PE ratio is less than the earnings growth rate of the underlying company you are buying.
Unfortunately in the case of PG at its current price - we are no where close to that kind of valuation.
PG's PEG ratio is sitting at 3.04x for 2014 (18.79 divided by 6.17) and 2.52x for 2015 (17.56 divided by 6.97)
Not cheap.
Now - there are a MILLION different ways to evaluate a company's worth that are more sophisticated that have merit and are worthy of your consideration - but I am using the PEG to show you what Neuhauser was talking about.
Remember what Neuhauser said.. "Never overpay for a stock. More money is lost than in any other way by projecting above-average growth and paying an extra multiple for it"
What does he mean by that?
Well in the case of our current example with PG, if we look at the company's compound growth rate (CAGR) in earnings from 1998 to 2015 (using current estimates) we find that PG has grown earnings at a rate of 7.82% per year - Pretty outstanding for a firm this mature.
But, if we buy the stock today at 19.94x trailing or 18.79x 2014's expected earnings, we are also breaking Neuhauser's timeless rule. This is where the financial industry can get itself into trouble.
Let me give an extreme example - if the PEG ratio on PG was 1.00 and reflected the company's average annual compound earnings growth rate from 1998-2015, the stock would be trading at $33.63, down over 58% from its current level.
recall: PEG ratio = PE ratio divided by Earnings growth rate.
SO to a 'strict Neuhasian valuation' would suggest a PE ratio of 7.82x on 2014e EPS of $4.30 - so 7.82 x 4.30 = $33.63
Even a less extreme compression in multiples suggests a big decline in the price of the stock. Assume for example that PG's current trailing PE ratio only fell from 19.94x to 18x. In that case, the stock would move from $80.79 to $72.92.
I would suggest that investors also be very mindful when they see a stocks target price increase solely on the back of an increase in the assumed multiple.
An example of what I mean:
Assume XYZ Brokerage Firm initiated coverage on the company in October of 2013 at $76.00 with an $80.00 target price. As the price rises closer to the target price and the overall market environment is still bullish, it is not uncommon for a target price to get bumped up. But, there are times when instead of earnings assumptions increasing - from say $4.30 to $4.45 for 2014 - the analyst just tweaks the assumed multiple. In this case they'd say something like:
We are increasing our 12 month target price on PG from $80.00 to $88.58. We continue to think PG will earn $4.30 in 2014, but think a more appropriate multiple is 20.6x earnings and not 18.6x.
So, even though the earnings estimates haven't increased, the firm has managed to bump up the target price by over 10%.. ta da!
I for one am very wary of multiple expansion assumptions on stocks (to increase a target price) as there is no way to verify what 'exact' multiple is appropriate.
And this brings me to the second part of my post.. the Asch Paradigm.
I always found this experiment kind of interesting -
Male college students participated in a simple "perceptual" task. In reality, all but one of the participants were "confederates" (i.e., actors), and the true focus of the study was about how the remaining student (i.e., the real participant) would react to the confederates' behavior. Each participant was placed in a room with seven "confederates". Confederates knew the true aim of the experiment, but were introduced as participants to the "real" participant. Participants were shown a card with a line on it, followed by a card with three lines on it (lines labeled A, B, and C, respectively). Participants were then asked to say aloud which line (i.e., A, B, or C) matched the line on the first card in length. Each line question was called a "trial". Prior to the experiment, all confederates were given specific instructions on how they should respond to each trial. Specifically, they were told to unanimously give the correct response or unanimously give the incorrect response. The group sat in a manner so that the real participant was always the last to respond (i.e., the real participant sat towards the end of a table). For the first two trials, the participant would feel at ease in the experiment, as he and the confederates gave the obvious, correct answer. On the third trial, the confederates would all give the same wrong answer, placing the participant in a dilemma. There were 18 trials in total and the confederates answered incorrectly for 12 of them. These 12 were known as the "critical trials". The aim was to see whether the real participant would change his answer and respond in the same way as the confederates, despite it being the wrong answer. Once the experiment was completed, the "real" participant was individually interviewed; towards the end of the interview, the participant was debriefed about the true purpose of the study. Participants' responses to interview questions were a valuable component of Asch's study because it gave him a glimpse of the psychological aspects of the experimental situation. It also provided Asch with information about individual differences among participants.
the results?
Overall, in the experimental group, 75% of the participants gave an incorrect answer to at least one question.
worth watching the video here -
Those work work in the business may never have heard of the "Asch Paradigm" before, but they are very familiar with its influence in the investment world.
"The central truth of the investment business is that investment behavior is driven by career risk. In the professional investment business we are all agents, managing other peoples’ money. The prime directive, as Keynes knew so well, is first and last to keep your job. To do this, he explained that you must never, ever be wrong on your own. To prevent this calamity, professional investors pay ruthless attention to what other investors in general are doing. The great majority “go with the flow,” either completely or partially. This creates herding, or momentum, which drives prices far above or far below fair price. There are many other inefficiencies in market pricing, but this is by far the largest."
and slightly shorter but very commonly used Aschian mantra in the investment world is
"Don't fight the Fed"
Peter Tchir of Brean Capital posted a wonderful article on Zerohedge this morning called,
that hints at the same Aschian phenomenon of conformity going on with the Fed's GDP forecasts. Peter's article is a 'must read' as he rightly questions how the Fed can justify its' call for strong future growth given the volatility we've seen in other economic data points to date.
So what to make of this post?
Well the market is continuing it's run higher, of that there is no debate. But, as Charles Neuhauser warned, more and more people are assuming an above average growth rate and then tacking on a few extra points to the multiple when they buy. The narrative of the day is that growth is getting better, and that escape velocity is 'right around the corner', but this narrative has been running in a similar fashion for the last five years. Maybe, just maybe we are seeing yet another example of what Asch discovered in his experiment and Jeremy Grantham mentioned in his letter.
Just ask yourself what happens to share prices if stock multiples start to reverse course and compress? What happens if PG's PE ratio falls from almost 20x to 12x (which as we know is still above it's longer term CAGR)? What happens if you find out the conformist's narrative was wrong?
Sure there are lots of different ways to value a stock and account for the rise we are seeing (PEG is obviously a very simple valuation method) - but that's entirely my point: When it comes to investing, you need to think for yourself and don't never fall victim to a conformity trap.