How does this 2 day rally compare to the historical average?
The 2 day rally that started December 16th of this year seemed unusually robust and euphoric - rocketing from a low (close) of 1972.74 to a whopping 2061.23 by the 18th - that's 4.49%.
I had already been running a bit of numbers in response to the "Bullard rally" in October, so I tweaked things a bit to see if I could see the context of the Dec 16-18 move relative to other big rallies in the S&P 500 throughout history.
Now, a huge warning about this post and its findings - I do NOT have a Bloomberg terminal, so all of the data crunching I've done here has been by hand. Exporting the daily pricing data into an excel spreadsheet, calculating the 2 day returns, ranking them - etc. It's been fun, but there may be bone headed errors, even though I've tried my best to be as accurate as possible.
After ranking all of the 2 day rallies going back as far as I could (1928) - I found the Great Depression was providing way too much noise. So I thought I'd look at the data from January 2nd, 1940 to December 2014.
When I did that, some interesting things happened.
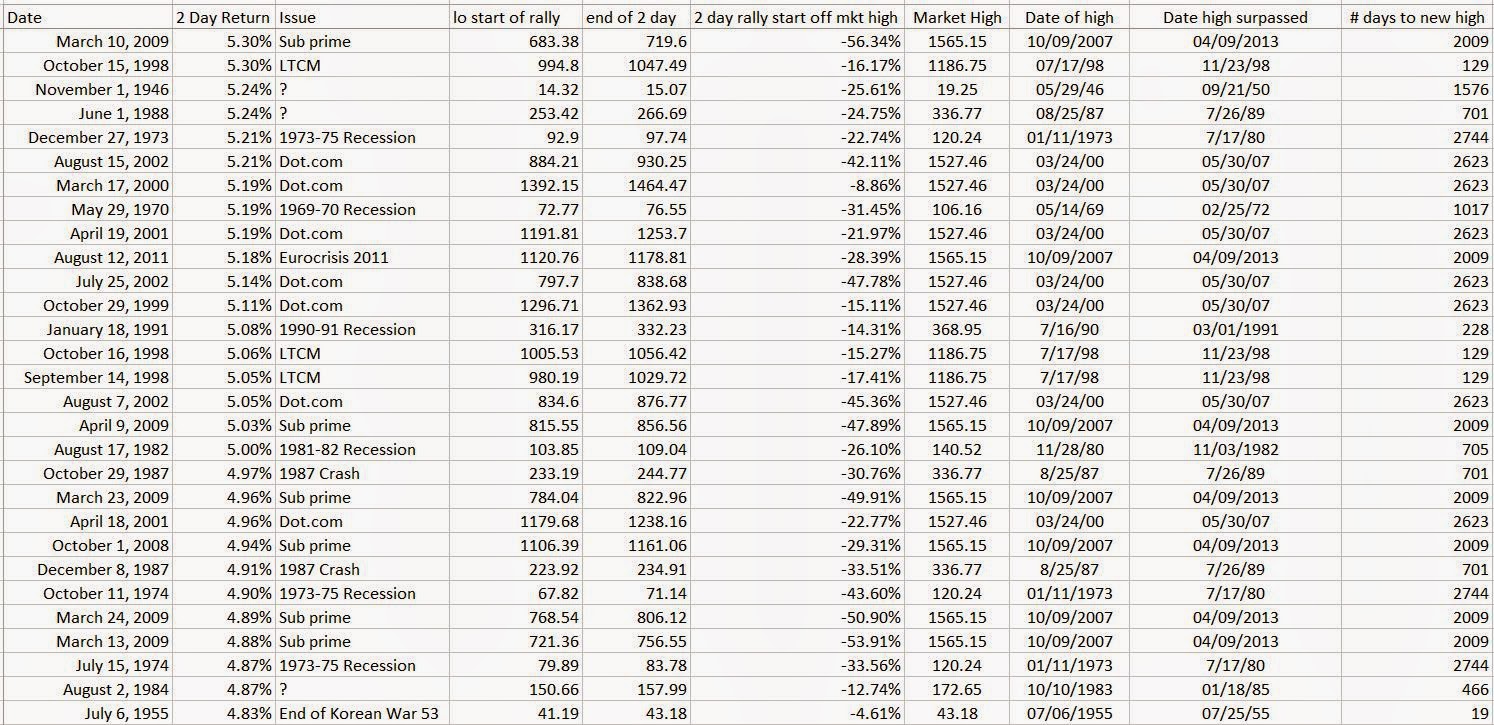
A - I found that the 4.49% rally we saw from December 16th to 18th was indeed noteworthy as it ranked as the 89th largest rally out of 18,853 2 day rallies in the data set. Not bad given a three sigma move is 5.05%.
B - I also noticed a tremendous cluster of similar dates on the other top rallies - 2008, 2000, 1998, 1973, 1982, etc
So, after ranking the top 100 2 day rallies back to 1940, I was able to categorize them into the following 12 events -
1. The 1987 Crash (Oct 19th, 1987)
2. The Sub-Prime Crisis
3. The Dot.com bubble
4. The 1973 - 1975 Recession
5. The 1981-82 Recession
6. The European Crisis of 2011
7. The 1990-91 Recession
8. The 1969-70 Recession
9. The Asian Flu
10. The LTCM Crisis
11. Various dates associated with war outbreaks
12. an "Unknown" classification - requires more research on the significance of each day
The date ranges I used for each particular crisis or event was the relative high as the start date, and the low as the end date. I did strip out the high market value reached before the Great Depression because the 31.86 high reached in 1929 wasn't recovered until 1954.
Doing this resulted in the following breakdown -
So, apart from the 14 days listed in the "unknown" category (which is more a function of me needing to do a bit more research than anything else) and the Dec 16-18th rally, 85% of the 2 day rallies between January 1940 and December 2014 occurred during a time of financial crisis, bubble chaos, recession or time of war. I found that very striking given the December 16-18th rally happened absent any of those markers.
The other question I had about the history or tendencies of huge 2 day rallies related to how they compared to the previous high. My guess was that many (or most) of these unusually large 2 day rallies would occur after a significant correction or pullback from a previous high. SO once again I did a bit of digging through the data.
I found the larger (ie top 100 2 day rallies) occurred only after the markets had corrected on average by 30%. The smallest correction (3.59%) and outlier 2 day rally of 5.46% occurred in November 1982, during the 1980-81 recession. But, it took 705 days to surge past the previous market high. The December 16-18 4.49% rally occurred after a 4.95% correction but only took 7 days to surpass the previous record high. This is unusual given the average number of days to surpass the previous record high is 1637 days.
While this breakdown doesn't provide any information that will help you with a trade, it does put the December 16-18 2 day rally of 4.49% into context. Given the rally occurred absent a recession, crisis, bubble or time of war - the magnitude of the rise is VERY unusual and should not be treated as 'normal' or "not noteworthy" -
A breakdown of the top 100 2 day rallies is snapped below for your interest - again, given this was all done by hand, there may indeed be some errors.. but I've tried to be as thorough as possible. If you notice an error please let me know and I will update my spreadsheet. Or, if you are able to track down any of the "unknown" events let me know..
If you find this information useful GREAT!! If you reproduce it, post it, etc.. please do me a favor and provide attribution. I don't post much but it would be nice to get some credit if you find the material interesting.
As you know I do a fair bit of bonds for my retail clients, so this piece was very interesting to me.. so - I set about to recreate Paul's work..
First, to make sure I had the right idea - I recreated Paul's graph from 1983 to 2005, just to make sure it looked similar.
not bad..
and then, I went off and applied the same set of rules to today's market. I've done this a few times (after the taper tantrum for example.. to check and see what I was missing) -
here's where we are today -
so to me, this continues to flash the "all clear" on rates. As such I don't think you will see rates rise because of fundamentals. We could however see a rate bump as per Gundlach's suggestions - but I doubt it would be much, or meaningful.. as the data just doesn't support a move higher at this point.
I'll say it until I am blue in the face.. I am NOT smart. I was never a kid who got A's in school, no matter how hard I tried or studied. I think one of my best qualities as a person who works in the financial industry is that I am very curious. I want to understand how things work to the best of my ability. While some are happy to just bob along like a cork in the big market, taking the returns that are given to them - that isn't okay with me. I want to UNDERSTAND the machine so that I have a very good idea of where these returns come from.
If you've been reading me here, or via my twitter account you know I have some major concerns about the market. To save time I won't rehash all of that here, but suffice it to say I don't think all is well out there.
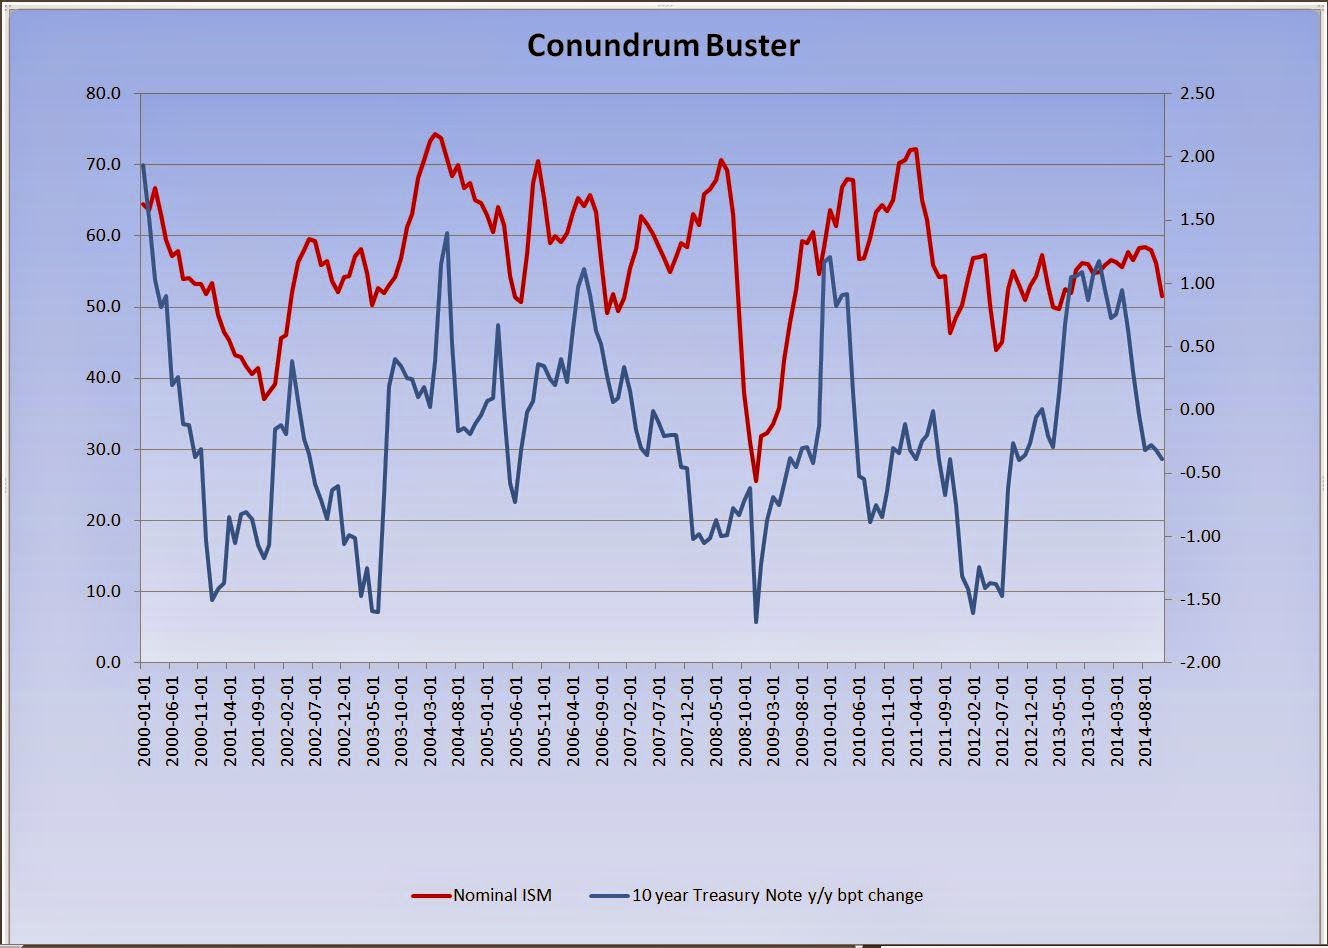
Anyhow - John Hussman recently posted a fantastic chart that I think really put things into perspective - it was in his Weekly commentary from September 8th
here's the chart -
I've seen a lot of charts over the years, but nothing screams "umm.. what?" more than this one. But given my natural inquisitive nature.. I wanted to take a deeper look at this chart to see if there was anything noteworthy under the surface. I mean the run on the S&P 500 from 2009 to today 'could be' justified if earnings, incomes, jobs and GDP growth was running at all time highs.
So I went to the best website on the planet for anything related to US macroeconomics FRED and pulled off the quarterly stats for GDP, Personal Consumption Expenditures and Corporate profits. I then hit Professor Shiller's website to snag the S&P 500 data along with the CAPE info.
Once it was all put into excel - I just created a base index using the respective starts of the bull markets to the nearest quarter (January 1995 to April 2000, January 2003 to October 2007 and April 2009 to present)
and came up with this (1995 bull for example).
I guess some will argue I should use different numbers, or a different base - or that GDP, PCE, EPS and CAPE figures don't matter.. and maybe that's true. It seems that economic fundamentals mean nothing these days.. but I have a very hard time thinking that they don't matter "anymore".
here's 2003-2007
and 2009 to 2014
Nothing screamingly obvious here.. but interesting to me none the less.
Here was the summary of each bull market's growth in the various components
and then I added it to Hussman's original chart..
It would be interesting to tear into the EPS data a bit more given the massive increase in share buybacks, and I'm sure there are all sorts of other data points that we could look at in addition to the ones I've picked here. I didn't try to cherry pick anything - instead just wanted to see if there was any major 'thing' that stood out. It does look like GDP and PCE are quite a bit lower than previous bull runs - but who knows.
Anyhow informative or not.. it was fun to play around here. I hope it inspires someone else to dig into this stuff in a bit more detail. Of course you know I tend to be leaning pretty significantly towards this market being a rather large bubble.. but obviously have no idea if or when it will pop.
The Stockdale Paradox is named after Admiral James B. Stockdale, who was the highest ranking US Military officer imprisoned in Vietnam during the war. Stockdale was shot down while flying a mission over North Vietnam on September 9th, 1965 and taken immediately to the infamous Hoa Lo prison, also known as "The Hanoi Hilton". Stockdale was a "prisoner of war" and 'lived' there for the next seven and a half years.
In the summer of 1969, he was locked in leg irons in a bath stall and routinely tortured and beaten. When told by his captors that he was to be paraded in public, Stockdale slit his scalp with a razor to purposely disfigure himself so that his captors could not use him as propaganda. When they covered his head with a hat, he beat himself with a stool until his face was swollen beyond recognition. When Stockdale was discovered with information that could implicate his friends' "black activities", he slit his wrists so they could not torture him into confession. Stockdale was released as a prisoner of war on February 12, 1973
Year later, author James C. Collins was interviewing Stockdale about his time at the Hanoi Hilton for a book called "Good to Great" - during the interview, Stockdale explained how he managed to survive all those years as a POW. He said,
"I never lost faith in the end of the story, I never doubted not only that I would get out, but also that I would prevail in the end and turn the experience into the defining event of my life, which, in retrospect, I would not trade."
Collins followed up by asking Stockdale who didn't make it out of Vietnam alive. Stockdale replied,
"Oh, that's easy, the optimists. Oh, they were the ones who said, 'We're going to be out by Christmas.' And Christmas would come, and Christmas would go. Then they'd say, 'We're going to be out by Easter.' And Easter would come, and Easter would go. And then Thanksgiving, and then it would be Christmas again. And they died of a broken heart."
Stockdale then added, "This is a very important lesson. You must never confuse faith that you will prevail in the end—which you can never afford to lose—with the discipline to confront the most brutal facts of your current reality, whatever they might be."
It was this philosophy of duality, that inspired Collins to describe it as the Stockdale Paradox.
Why am I writing about this rather dark and depressing paradox this month?
Well as I am sure you have figured out by now, I think it does a wonderful job of explaining how I am wired as a Portfolio Manager. While my letters over the years may sound dire and dark, the truth of the matter is that I have great hope and excitement about our future. I have faith that we will see through these difficult times, and get back to less chaotic days. But, as with Stockdale, I also possess the discipline to confront the most brutal facts of our current reality.
It was this discipline that enabled me (as you know) to completely avoid the dot.com bust in 2000, as well as the Great Financial Crisis of 2008/09, even as many in the industry ere busy assuring investors that "all was well" - .
Of course we know both of the statements above turned out to be spectacularly incorrect, and led to massive losses by investors.
Now, in 2014 the stock market has hit all time record highs as expectations that the US economy is approaching "escape velocity" - but, my discipline and macroeconomic research believes this is yet another naively optimistic narrative.
To borrow the paradox above, the US stock market has been saying they will see escape velocity by Thanksgiving, then Christmas, then New Years, then Easter.. Those of us who have been keeping track know that they've been saying this for the last 5 years.
Confronting the brutal facts about our current economic situation tells us that while things are certainly better than they were in January or February 2009, they are a very long ways away from anything that could be construed as "Escape velocity". As such, the longer true "escape velocity" eludes the US economy, the stock market as with those unfortunate souls who did not make it out of the Hanoi Hilton, run a massive risk of dying from a broken heart.
Just something to consider.
* a h/t to Zerohedge. While I was very familiar with the story of James Stockdale's torture, I had forgotten about the paradox - something they mentioned in two fantastic posts here and here. I wrote something similar not to try and pretend this was my original idea, but to record these thoughts on my own blog for future reference.
I should preface this - and all of my posts for that matter - by saying that my scope and experience is purely on the retail advisory side. I've never worked in straight banking, nor on the institutional side and I don't have a CFA and am certainly NOT an equity analyst. I started straight out of University in 1993 and everything I know today I've picked up along the way.
I run individual investment portfolios - I manage the investments of your Mom or Dad, your Grandparents, or your Aunts and Uncles. I don't do futures or currencies and stick to running mostly vanilla stocks and bonds.
The more I read about how some people trade via twitter, the more I realize that my specific portion of the investment world is basically the phytoplankton of finance. We are small and individually insignificant but do play a big part in supporting the bigger financial ecosystem. Bigger players have other terms for us, "muppets" comes to mind.. which is fair enough, so call me Gonzo.
I will concede that perhaps the observations I make, as a small phyto-financial plankton don't mean a hill of beans to the bigger ecosystem. But if I do say so myself I think I have developed a bit of a knack for identifying problem areas before they occur.
Yes I admit it freely - I'm wired to worry.
I am more often than not inclined to take the safer road and the cautious approach than to seek out risk. Personally think you kind of need this mindset if you want to work in retail and manage "Other People's Money".
I mentioned the problem that I have with analysts getting "lazy" with their target prices and advice on stocks in "Charles Neuhauser meets the Asch Paradigm" - in today's market I am seeing a TON of target prices getting bumped up even as earnings estimates fall. Paying 24x next year's estimated earnings on a stock whose longer term eps growth rate averages 4 or 5% is just asking for trouble.. but, many ignore the rules.
AH well.
I'm seeing so many target prices being bumped up a few dollars via an expanded multiple assumption rather than any higher assumed earnings - just so analysts don't have to answer the question of why the stock isn't a sell.
It's that Keynesian career risk thing - you don't want to put a sell recommendation on a stock only to have it keep rolling higher on you.. client's don't dig that.
But you know what? An expensive stock is an expensive stock.. and call me naive but if you are simply slapping an additional 1.5x multiple on an ALREADY LOFTY forward PE.. just because the momentum of the stock continues to be higher.. what sort of value are you adding to the portfolio?
Also - given earnings growth and fundamentals are clearly NOT driving the share price.. how on earth are you going to know when to get the hell out of the way?
I find too many just accept the upside without paying too much attention to the fine print (or lack thereof).
Stock is moving through your target price? Well then take a look at your model and see if you are missing anything that could explain the action.. more growth coming from somewhere you didn't anticipate? Are your earnings expectations too conservative? But for god's sake don't just look at the street consensus and slap another 1.5x on so you can increase your target price by $5.00..
Clients pay us a lot of money to work diligently on their behalf.. if a stock is expensive.. it's expensive.. if it has a target price of $50.00 and it's trading at $56.00 with no new catalysts to push your earnings estimates higher.. you need to at LEAST do the math to see if you should ease the size of the position down.
If I'm running my own funds then it doesn't matter - but the last thing in the world you want to do is be overly optimistic on a stock or market with client money..
Most in retail tend to be fairly heavy in equity anyhow (some I know are basically 100% in stock.. holy crap..) - so if they are WRONG on the recovery and the bull market.. they don't get hurt.. but man, do the clients get smoked.
Just a small rant.. I saw about four 'increased target prices' using the same cheeky pe expansion (even as estimated earnings were REDUCED!!!)
Somewhere, Charles Neuhauser is shaking his head and waiting to say
"Worldly wisdom teaches that it is better for reputation to fail conventionally than to succeed unconventionally"
John Maynard Keynes - "The General Theory of Employment, Interest and Money"
As a retail portfolio manager who runs individual investment accounts, words can't describe how much I dislike the quote above. To me it's a cop out - it's lazy, ill advised and ultimately ends up hurting clients.
Is it really better for one's career to be wrong along with the majority than it is to stick to a well thought out long term strategy that may be 'out of favor' or unappreciated at the moment?
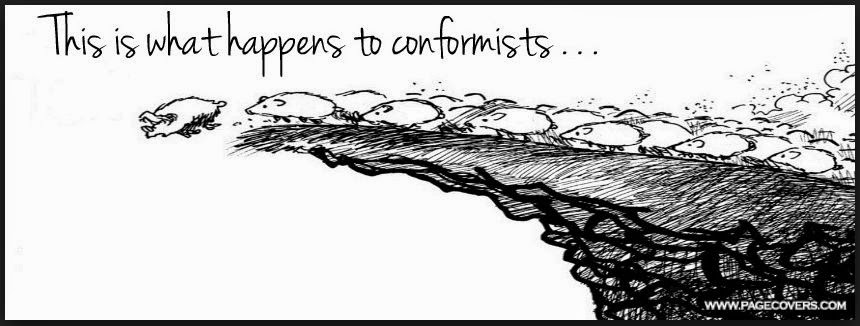
To me, Keynes seems to be endorsing a kind of "Blind Lemming" approach to investing. The sweet irony here is that the whole lemming "mass suicide" thing is a myth that has been perpetuated by humans for eons. Of course reality follows logic: No, lemmings aren't dumb enough to blindly follow the masses off a cliff "just because everyone else is doing it". Unfortunately, many in the financial industry didn't get the "lemming myth" memo and instead have invested (their client's money) heavily in the myth.
Sure, career risk is very real and something that all of us have to be aware of - but does that mean we need to blindly follow or invest in something that we don't believe or understand, just so we can conform with the majority?
"The opposite for courage is not cowardice, it is conformity. Even a dead fish can go with the flow"
Jim Hightower
said another way
The Keynesian lemming model can be found everywhere in the financial industry. Sure, it's not CALLED the Lemming model - because that would raise red flags. Instead the Lemming model for finance has been subtly hidden in pithy, bold, and well-known investment mantras such as:
"Don't fight the Fed"
and
"The Trend is your Friend".
"Don't fight the Fed" is considered good investment advice? Really?
Are we talking about the same Fed that had a hand in creating the dot.com bubble, the housing bubble, and the financial crisis of 2007/09 (to name a few)?
If it is - then why in the hell would you ever want to hook your wagon to their track record?
Forget the Fed for a moment. Instead assume there was a pilot who had a history of acting irresponsibly. Over the last 15 years, this pilot's irresponsible actions led to him to crash his plane twice, causing untold damage, death and pain. If we follow the same "Don't fight the Fed" logic, I should be seeking out said pilot when I choose to travel, and be happy and excited about flying with him. Does that make sense?
Assuming the irresponsible pilot doesn't recognize that he has a problem, and therefore doesn't change his ways - what is the likelihood of us being involved in another crash?
Following the same thought process then - if the Fed doesn't recognize that it has a problem, and therefore doesn't change it's approach - what is the likelihood of another Fed induced crisis/crash?
Sure, maybe it's a few years down the road.. but my point here is don't mindlessly "go with the flow" simply because everyone else is doing it.
If you are going to invest - have a model, have a method, have a discipline.
The best, NON-Lemming quote I've seen in a while is this:
"I would rather lose half of our clients, than half our client's money"
Jean Marie Eveillard
Perhaps this issue doesn't apply with the institutional side, or for people who simply trade their own capital - but for running other people's money - it's absolutely KEY.
The last thing in the world anyone on the retail side wants to do (assuming they care about their client's well being, and aren't a sociopath) is blow up a client's financial future simply because they were "following the masses" in an effort to not look stupid. To me there is nothing more intellectually dishonest than sending out a "There was no way to have seen this coming" letter to try and explain what went wrong AFTER blowing up a client's account on a correction that they should have seen coming. The DOT.COM and 2007/09 corrections are PERFECT examples of situations where a broker 'should' have seen it coming - I mean really.. it wasn't rocket science.
Unfortunately today, I am seeing a LOT of complacency on the retail side of the business. Too many brokers walking around thinking the returns they are earning is because of their own brand of genius rather than the plethora of financial morphine sloshing around in the system. I've overheard "It's almost too easy" and "it's like shooting fish in a barrel" far too many times for my liking - just as I did in '98, '00 and '07.
While many may assume I am a 'perma-bear' I can tell you I am not - I am a realist. If and when the investment environment changes, my views will change. Unfortunately from where I sit, nothing has really changed. The problems, flaws and abuses continue to exist and there seems to be no desire to change the approach or come up with a workable solution. This is something I've been saying since 2009, although I have noticed more and more people are starting to suggest the same thing - (Maximillian Zimmerer, CIO of Allianz SE recently said "The fundamental problems are not solved and everyone knows it")
So what to do?
All I suggest is that investors be keenly aware that many of those bold and courageous quips we keep hearing from CNBC and the TV gurus aren't calls to be wise. Instead they are fluffy, ill thought out calls to conform to the Lemming Mentality. It's a call not to think - but to just mindlessly go with the flow.
So, when someone gives you a little investment advice such as:
"The Trend is your friend" "Stocks always outperform over the long term" "Stocks are the only game in town"
"The market can stay irrational longer than you can stay solvent"
"Don't fight the Fed"
"The economy isn't the stock market"
"The consumer doesn't matter"
"Earnings/Sales/GDP/Wages doesn't matter"
"It's a whole new paradigm" "The cleanest dirty shirt.."
and
"This time it's different"
know what they are really suggesting is this -
Yes - Maybe it will take a while for reality to hit, for the mean to revert or for fundamentals to matter again.. but at some point they will - because they always do. All I'm suggesting is that if you run money on behalf of someone else, that you be keenly aware of Keynes' endorsement of the lemming myth.
"Never overpay for stock. More money is lost than in any other way by projecting above-average growth and paying an extra multiple for it"
Charles Neuhauser, Bear Stearns
This has always been one of my favorite quotes, and I think it's one of the most relevant thoughts I've ever come across. Of course these days, valuation and fundamentals have been thrown into the back seat as other factors are currently influencing the market's direction. But, valuation - what you pay for the companies you buy - is always important. No matter what is going on in the short to medium term.
With that in mind, I wanted to give an example of what I'm struggling with regarding current stock valuations, and then tie that into Asch's paradigm in an effort to show how the financial industry gets itself into trouble from time to time.
So I thought I'd pick a company whose business I like, but am wary of the valuation. A name that everyone knows, and that has a great global brand: Proctor & Gamble (NYSE: PG). I like the company because of it's incredible stability. It's paid a dividend every year since 1890, and has raised its dividend for 58 years in a row. The company boasts an incredible brand - selling products under the names Tide, Gillette, Pampers and Crest.
So a quick look at Valueline shows 2014 actual earnings were $4.05 - which suggests PG trades at 19.94x 'trailing earnings' -
Sidenote: See, way way back when I started in the business (1993) all PE ratios were based on trailing earnings, as those were the earnings actually earned and recorded into the books. The 'forward earnings' references started a few years after I started. Initially research pieces quoted forward earnings only going out a year into the future, but as the practice took root, it's now not unusual to see estimates going out three years. We will get back to this on the second part of the discussion.
If the earnings for PG in 2014 are expected to come in at $4.30, and 2015 at $4.60, then PG is said to be trading at 18.79x 2014e EPS and 17.56x 2015e EPS. See? Doesn't the idea of paying 17.56x to buy PG sound so much better and more reasonable than buying it at 19.94x?
Now, here is where Neuhauser's comments come into play.
An increase in earnings from $4.05 to $4.30 is 6.17%, and an increase from $4.30 to $4.60 is 6.97%. In its most simple form, value investing is when you are buying a company at a cheap price relative to its earnings growth rate. Using a PEG ratio measure (a ratio of PE ratio divided by a company's earnings growth rate) the goal is to buy a company under 1.00 - that is, you are buying a company whose PE ratio is less than the earnings growth rate of the underlying company you are buying.
Unfortunately in the case of PG at its current price - we are no where close to that kind of valuation.
PG's PEG ratio is sitting at 3.04x for 2014 (18.79 divided by 6.17) and 2.52x for 2015 (17.56 divided by 6.97)
Not cheap.
Now - there are a MILLION different ways to evaluate a company's worth that are more sophisticated that have merit and are worthy of your consideration - but I am using the PEG to show you what Neuhauser was talking about.
Remember what Neuhauser said.. "Never overpay for a stock. More money is lost than in any other way by projecting above-average growth and paying an extra multiple for it"
What does he mean by that?
Well in the case of our current example with PG, if we look at the company's compound growth rate (CAGR) in earnings from 1998 to 2015 (using current estimates) we find that PG has grown earnings at a rate of 7.82% per year - Pretty outstanding for a firm this mature.
But, if we buy the stock today at 19.94x trailing or 18.79x 2014's expected earnings, we are also breaking Neuhauser's timeless rule. This is where the financial industry can get itself into trouble.
Let me give an extreme example - if the PEG ratio on PG was 1.00 and reflected the company's average annual compound earnings growth rate from 1998-2015, the stock would be trading at $33.63, down over 58% from its current level.
recall: PEG ratio = PE ratio divided by Earnings growth rate.
SO to a 'strict Neuhasian valuation' would suggest a PE ratio of 7.82x on 2014e EPS of $4.30 - so 7.82 x 4.30 = $33.63
Even a less extreme compression in multiples suggests a big decline in the price of the stock. Assume for example that PG's current trailing PE ratio only fell from 19.94x to 18x. In that case, the stock would move from $80.79 to $72.92.
I would suggest that investors also be very mindful when they see a stocks target price increase solely on the back of an increase in the assumed multiple.
An example of what I mean:
Assume XYZ Brokerage Firm initiated coverage on the company in October of 2013 at $76.00 with an $80.00 target price. As the price rises closer to the target price and the overall market environment is still bullish, it is not uncommon for a target price to get bumped up. But, there are times when instead of earnings assumptions increasing - from say $4.30 to $4.45 for 2014 - the analyst just tweaks the assumed multiple. In this case they'd say something like:
We are increasing our 12 month target price on PG from $80.00 to $88.58. We continue to think PG will earn $4.30 in 2014, but think a more appropriate multiple is 20.6x earnings and not 18.6x.
So, even though the earnings estimates haven't increased, the firm has managed to bump up the target price by over 10%.. ta da!
I for one am very wary of multiple expansion assumptions on stocks (to increase a target price) as there is no way to verify what 'exact' multiple is appropriate.
And this brings me to the second part of my post.. the Asch Paradigm.
I always found this experiment kind of interesting -
Male college students participated in a simple "perceptual" task. In reality, all but one of the participants were "confederates" (i.e., actors), and the true focus of the study was about how the remaining student (i.e., the real participant) would react to the confederates' behavior. Each participant was placed in a room with seven "confederates". Confederates knew the true aim of the experiment, but were introduced as participants to the "real" participant. Participants were shown a card with a line on it, followed by a card with three lines on it (lines labeled A, B, and C, respectively). Participants were then asked to say aloud which line (i.e., A, B, or C) matched the line on the first card in length. Each line question was called a "trial". Prior to the experiment, all confederates were given specific instructions on how they should respond to each trial. Specifically, they were told to unanimously give the correct response or unanimously give the incorrect response. The group sat in a manner so that the real participant was always the last to respond (i.e., the real participant sat towards the end of a table). For the first two trials, the participant would feel at ease in the experiment, as he and the confederates gave the obvious, correct answer. On the third trial, the confederates would all give the same wrong answer, placing the participant in a dilemma. There were 18 trials in total and the confederates answered incorrectly for 12 of them. These 12 were known as the "critical trials". The aim was to see whether the real participant would change his answer and respond in the same way as the confederates, despite it being the wrong answer. Once the experiment was completed, the "real" participant was individually interviewed; towards the end of the interview, the participant was debriefed about the true purpose of the study. Participants' responses to interview questions were a valuable component of Asch's study because it gave him a glimpse of the psychological aspects of the experimental situation. It also provided Asch with information about individual differences among participants.
the results?
Overall, in the experimental group, 75% of the participants gave an incorrect answer to at least one question.
worth watching the video here -
Those work work in the business may never have heard of the "Asch Paradigm" before, but they are very familiar with its influence in the investment world.
"The central truth of the investment business is that investment behavior is driven by career risk. In the professional investment business we are all agents, managing other peoples’ money. The prime directive, as Keynes knew so well, is first and last to keep your job. To do this, he explained that you must never, ever be wrong on your own. To prevent this calamity, professional investors pay ruthless attention to what other investors in general are doing. The great majority “go with the flow,” either completely or partially. This creates herding, or momentum, which drives prices far above or far below fair price. There are many other inefficiencies in market pricing, but this is by far the largest."
and slightly shorter but very commonly used Aschian mantra in the investment world is
"Don't fight the Fed"
Peter Tchir of Brean Capital posted a wonderful article on Zerohedge this morning called,
that hints at the same Aschian phenomenon of conformity going on with the Fed's GDP forecasts. Peter's article is a 'must read' as he rightly questions how the Fed can justify its' call for strong future growth given the volatility we've seen in other economic data points to date.
So what to make of this post?
Well the market is continuing it's run higher, of that there is no debate. But, as Charles Neuhauser warned, more and more people are assuming an above average growth rate and then tacking on a few extra points to the multiple when they buy. The narrative of the day is that growth is getting better, and that escape velocity is 'right around the corner', but this narrative has been running in a similar fashion for the last five years. Maybe, just maybe we are seeing yet another example of what Asch discovered in his experiment and Jeremy Grantham mentioned in his letter.
Just ask yourself what happens to share prices if stock multiples start to reverse course and compress? What happens if PG's PE ratio falls from almost 20x to 12x (which as we know is still above it's longer term CAGR)? What happens if you find out the conformist's narrative was wrong?
Sure there are lots of different ways to value a stock and account for the rise we are seeing (PEG is obviously a very simple valuation method) - but that's entirely my point: When it comes to investing, you need to think for yourself and don't never fall victim to a conformity trap.
The story of the Farmer and the Viper is one of Aesop's fables and goes something like this,
A farmer finds a viper freezing in the snow. Taking pity on the snake, the farmer picks it up and places it inside his coat. The farmer's body heat revives the viper who then immediately bites its would be rescuer.
While there are various endings (and therefore morals) to the story, the one I thought I'd focus on for this post comes from Odo of Cheriton. In this version the dying farmer asks for a simple explanation why the snake would deliver a mortal bite given the farmer's compassion. The snake answers,
"Did you not know there is enmity and natural antipathy between your kind and mine? Did you not know that a serpent in the bosom, a mouse in a bag and a fire in a barn give their hosts an ill reward?"
As you probably noted in my previous post about the US economy, I have some pretty cynical and sharp views about the financial industry. Ironic I know as I've worked in the industry for over 20 years. To my defense, I wasn't always this skeptical. I started in the business with the same wonderment and awe as every other rookie who was hired on to work at a brokerage firm. No, my cynicism was accumulated over the years, as the shiny veneer peeled away and I got a better understanding of the darker workings industry. Now, let me stop right there and say there are obviously a TON of amazingly brilliant, honest and wonderful people who work in this business. But, there are also a lot of vipers as well and they are threatening our economy (again). Why?
Dr. Robert Hare from the University of British Columbia wrote a book with industrial psychologist Paul Babiak called "Snakes in Suits: When Psychopaths go to Work". The book discusses how psychopaths work (and excel) in the corporate world. An article on MSN referenced Hare and Babiak's work and highlighted that in a very small study of 203 corporate executives, 4% met the criteria to be deemed a 'psychopath' - an interesting number given the average for the general population is about 1%. Moreover, Hare made a very interesting comment in the article specifically about the financial industry -
"it may even be higher than 10%, on the assumption that psychopathic entrepreneurs and risk-takers tend to gravitate toward financial watering-holes, particularly those that are enormously lucrative and poorly regulated".
Ding Ding Ding.
Okay, not convinced yet?
How about this story from 2011 - "Going Rogue" - that discussed the case against UBS trader Kweku Adoboli who made unauthorized trades that led to losses of about $2.3 billion?
this was the part of the article that stood out to me:
"According to a new study at the University of St. Gallen seen by SPIEGEL, one contributing factor may be that the stockbrokers' behavior is more reckless and manipulative than that of psychopaths. Researchers at the Swiss reseearch University measured the readiness to cooperate and the egotism of 28 professional traders who took part in computer simulations and intelligence tests. The results, compared with the behavior of psychopaths, exceeded the expectations of the study's co-authors, forensive expert Pascal Sherrer, and Thomas Noll, a lead administrator at the Poschwies prison north of Zurich. "Naturally one can't characterize the traders as deranged," Noll told SPIEGEL, "But for example, they behaved more egotistically and were more willing to take risks than a group of psychopaths who took the same test".Particularly shocking for Noll was the fact that the bankers weren't aiming for higher winnings than their comparison group. Instead they were more interested in achieving a competitive advantage."
But are guys like Kweku Adoboli, Jerome Kerviel, Yasuo Hamanaka and Nick Leeson just a few bad apples? Is there really only one or two cockroaches here?
"Functional psychopaths make the best investment decisions because they can't experience emotions such as fear, a study by researchers at Standford Graduate School of Business showed. Fear stops people from taking even logical risks, meaning those who have suffered damage to areas of the brain affecting emotions, and can supress feeling, make better decisions, the report showed. The ability to control emotion helps performance in business and financial markets, the researchers found".
So what am I trying to say here? What is the point of this particular blog entry?
Well, let me lay out my thesis.
1. The financial industry attracts a higher proportion of psychopaths than would be found in the general population.
2. Psychopaths display characteristics that allow them to excel in the industry but they are also tend to pursue reward at any cost, or risk.
3. Given these competitive advantages and successes (see #2) - we can assume that psychopaths would tend to climb the corporate ladder faster than others, and therefore would tend to cluster at the top of an organization.
4. Given the clustering of like minded individuals with common goals (ie pursuing rewards at any cost) the psychopathology would lead to less ethical behavior and heightened risk taking for that company or industry. William Black describes this as "Control Fraud"
5. A Gresham's dynamic compels other competitors to adopt similar tactics until the entire industry is affected.
This I believe played a large part in the lead up to (and fall out of) the Great Financial Crisis of 2008.
But here's the problem. Who did we turn to to help get us OUT of the Financial Crisis?
Wall Street.
Wall Street convinced everyone (just ask Tim Geithner) that it was critical to save them. So we did.
But therein lies the problem - and why I referenced the Farmer and the Viper story above.
Yes - we saved Wall Street, but failed to clear out or even control the activities of the 'psychopaths'. So, it is absolutely naive and unreasonable for us to assume that today they have "seen the light" and are going to change their behavior going forward.
How many times have we, the Farmers - saved Wall Street only to be lethally bitten once they recovered from the cold?
Again, I am not saying that 'everyone' in the industry is bad - clearly they aren't. But I can't help but notice some of the excesses of old are starting to creep back into the marketplace..
I am also seeing a lot of commentary lately given the fine imposed on Credit Suisse - and how it will not end up being a deterrent for future abuses. Credit Suisse got off lightly
It's happening again - and I will say I am worried.
Change will only come when we, the people, demand it. It is our duty to facilitate sweeping changes in the financial industry to once again realign our objectives with our clients.
And we need to do this soon, lest we find ourselves mortally bitten once again and asking "why".
I have a confession to make: I've never met a piece of paper that I didn't like. To the left is a scanned copy of a research report that I've carried with me through a firm change, two office changes and over 14 years of work. I kept the report because as soon as I saw it, I knew it contained the kind of important lesson that one would want to remember for the rest of their career. Now, to be fair it doesn't matter what firm it was, nor who the analyst at the time was. That part is neither here nor there because as most of us who worked during the dot.com days know, this report was more the rule and not the exception. EVERYONE was bullish on technology in December of 1999. Well, not 'everyone' - as you probably can imagine, I was decidedly NOT bullish on tech. Not because I didn't understand the technology because I did, and used it a fair bit. I had my own website in 1993, wrote my own html, and had figured out a way to hook up my cell phone to my laptop to access my dial-up account so I could show clients stock quotes during meetings at their homes. What I didn't understand about tech were the astronomical valuations.
It's funny - when you talk about the dot.com bubble now, people nod their heads and go "yeah yeah, it was a crazy time..", as if by rote. And when you ask them where they worked at the time, you find out they were in grade 11 and weren't actually working through it. For those of you who did work during that time, then you know damned well the 'bubble' tag only came after it popped. Prior to it popping, there was a TON of debating going on about the validity of the run. I know I tried my best to warn people, but in return was told how it was a 'new paradigm' and how I needed to 'think outside the box' - whatever the hell that meant.
I had been in the business for six years - was still pretty small (hell, still am) - but was a keen student of the market. Always reading, always trying to learn, always trying to understand.
To me, the research piece above shows you the dangers in complacency - the dangers in style creep - the dangers of changing a narrative to justify why a stock price is going up.
With the benefit of 20/20 hindsight we now know that adopting a "Price to sales" model was NOT a better indication of Nortel's value. We also know that a red flag should have been waving when Nortel's management stopped disclosing details about their product line revenues in '98. We should have realized that putting a $180 two year target on a stock with a 92x multiple (and 20% earnings growth) was maybe paying a bit too much.
The point I'm trying to make is this - when the stock market starts really rolling, it's critical to stick to your discipline. If a stock looks expensive based on the models you use, then guess what - it's expensive. Sure, maybe it gets "more" expensive - but if you stick to your discipline, then that becomes someone else's problem.
Why is that relevant now? Well, the S&P is hitting new highs, I'm hearing lots of stories about an economic recovery but haven't seen much in over five years in fact I'd suggest things are starting to slow down again - and.. apparently it is everyone's belief that corporate profit margins are going to stay fat forever.
David Tepper made a great point yesterday - we are getting complacent. It's not a new paradigm, it never is - gravity will apply tomorrow just like it applied 100 years ago.
Outlying statistics ALWAYS mean revert - we don't know when but it's kind of a mathematical law..
just maybe something to kick about in your own head as you enjoy the cool chart I made today with Doc Shiller's great data.
As I've stated before, writing anything is a bit of a struggle for me, and I wasn't happy with my original posting of this, so I've gone back in and retweaked a few things. None of the main research is any different, but I've added a bit more of a conclusion to it. Obviously I need to write a LOT more about my view, but this is a start and will provide people with the basics of why I don't feel as though any recovery we see in the US will be sustainable and 'robust'.
Nice to see Thomas Piketty's book getting so much attention given income inequality carries a large weighting in my view as well. I have it but haven't had enough time to read the book but sounds as though his suggested solutions are a bit controversial. From my view, any discussion is a positive thing because it means we are finally becoming aware of the problem and starting to debate solutions.
anyhow - here are my (revised) thoughts - I hope you find them interesting.
EXECUTIVE SUMMARY:
The US economy was broken
long before the Financial Crisis and “Great Recession” of 2008/09. The crisis
and corresponding recession were therefore symptoms of a much larger and far
less understood structural problem. Failure by economists, analysts and Central
Banks to properly understand these underlying issues is resulting in misguided
policy responses which are not only yielding insufficient results, but a growing
list of dangerous unintended consequences as well.
The introduction of
workers from China, India and the former Soviet Republic in the early 90s
doubled the global labor pool almost overnight. This massive influx of new
workers from emerging markets were willing to work for lower wages compared to their
North American and European counterparts which created a ‘labor arbitrage’
opportunity for market savvy corporations. By moving their manufacturing bases
to these emerging markets, companies paid significantly less on their labor
inputs (wages) and therefore enjoyed a dramatic increase in profitability. The benefits
of “outsourcing” were so significant that a large majority of companies had to
follow suite to ensure that they remained competitive within the global
economy.
The positive impacts from outsourcing
were enjoyed almost immediately as prices on consumer products declined, and
the stock markets soared spurred on by record high corporate profits. The
negative consequences of outsourcing (while present) were far less obvious. Hidden behind the record markets and surge in
consumption were job losses, declining relative wages, a hollowing out of the
manufacturing base of the economy, a decline middle class through income
inequality, and an increasing reliance on debt to maintain a falling standard
of living.
The economic and housing
market bubbles that burst in 2008 were simply symptoms of a bigger and more
complicated problem that had finally hit a tipping point. Consumers had been
spending beyond their means and had accumulated an unhealthy amount of debt in
the process. Contrary to the headlines and economic reports we read today, the “The
Great Recession” has not ended for most citizens. The policy response of choice
by Central Banks has been to focus on increasing the value of the stock and
housing market, in the hope that a trickle down ‘wealth effect’ will stimulate
a more sustainable economic recovery. Unfortunately there is a volume of research
showing that wealth effects on the overall economy are marginal at best. As a
result, the focus solely on the level of the stock market has led income
inequality between the ‘haves’ and ‘have nots’ to surge to levels not seen
since just before the Great Depression of the 1920s.
Failure to properly identify
and resolve the true cause of our economic problems has created a massive
disconnect between the stock market and the economy, which in turn has greatly
increased the implied risk levels faced by investors. While optimistic headlines
promise that better times lie just ahead, the reality is that the US consumer
(and therefore economy) continues to suffer from an unresolved sickness which
makes a full ‘recovery’ impossible.
Main Paper:
Having long threatened to write something
explaining my longer term view on the investment world, an article by Nobel
laureate Joseph Stiglitz on February 6th of this year finally pushed
me over the edge. In “Stagnationby Design” Stiglitz suggested that the US economy was sick even before the
financial crisis of 2008.
"The basic point that I raise a half-decade ago was that, in a fundamental sense, the US economy was sick even before the crisis; it was only an asset-price bubble, created through lax regulation and low interest rates that had made the economy seem robust. Beneath the surface, numerous problems were festering; growing inequality; an unmet need for structural reform (moving from a manufacturing-based economy to services and adapting to changing global comparative advantages); persistent global imbalances; and a financial system more attuned to speculating than making investments that would create jobs, increase productivity, and redeploy surpluses to maximize social returns"
I have been making this same argument for
many years and have been frustrated by the lack of available research and
commentary that puts all of the pieces of the puzzle together. To date I have
seen very little published anywhere that sets out to explain why
the US economy was sick before the Financial Crisis hit. It is my hope that
this document will add some light to these trends and more importantly, inspire
others to expand on this work in greater detail.
The basis of my investment thesis draws largely
from the work of Sir James Goldsmith’s 1993 book, “The Trap”.
A short summary of Goldsmith’s concerns were discussed in an interview he had
with Charlie Rose in 1994
Goldsmith’s concerns were quite simple: GATT,
the General Agreement on Tariffs and Trade model, was based on flawed logic. In
the interview Goldsmith worried that if GATT was fully implemented it would,
“Impoverish and destabilize the industrialized world while at the
same time cruelly ravaging the third world”
Goldsmith elaborated,
“It
must surely be a mistake to adopt an economic policy which makes you rich if
you eliminate your national workforce and transfer production abroad, and which
bankrupts you if you continue to employ your own people”.
Goldsmith’s concerns related to the
economic distortions created by the introduction of China, India and the former
Soviet Union Bloc (CIFSB) being fully integrated to the global labor &
trade market.
“If 2 billion people enter the same world market for labor and offer
their work at a fraction of the price paid to people in the developed world, it
is obvious that such a massive increase in supply will reduce the value of
labor”.
Goldsmith’s
book was first published in 1993, and his interview with Charlie Rose was held
in 1994.
Unfortunately Sir James Goldsmith passed away in 1997, so we no longer
have his wisdom to draw from.
But, 21 years have passed since “The Trap”
was printed so we do have a lot of data with which to measure the validity of
this theory and accuracy of his predictions. The remainder of this paper sets
out to do exactly that.
The year 2000 also marked a huge change in
the political systems of China, India and the former Soviet Bloc (CIFSB). This
change enabled CIFSB laborers to enter the global labor pool en masse for the
first time in history. This transition was unprecedented and, as James Goldsmith
forecasted 7 years prior, added an additional 1.47 billion people to the Global
labor pool.
The laws of supply and demand suggested
that this massive influx of new workers to the global labor pool would have a deflationary influence on the level of global
wages. Further amplifying this downward pressure on wages was the fact that the
CIFSB workers hailed from relatively more impoverished “emerging markets” and
were therefore willing to work for far less than the going global wage. As
such, a labor arbitrage opportunity now existed whereby corporations with
nimble capital could move their centers of production and manufacturing to these
lower labor cost emerging markets in an effort to maximize their profitability.
This labor arbitrage opportunity became the driving force behind the trend
known later on as “outsourcing”.
2. Outsourcing Trends
“French
voters are trying to preserve a 35-hour work week in a world where Indian
engineers are ready to work a 35-hour day. Good luck” - ThomasFriedman
While outsourcing was already in use prior
to the 1990s, the sheer number of new CIFSB entrants into the Global labor pool
was unprecedented and therefore became highly disruptive to the global economy.
It didn’t take long before many European and North American companies began to
outsource many of their operations to take advantage of the lower wages paid in
the emerging markets. The impact from outsourcing was felt almost immediately:
Corporate profits started to expand at a faster rate while manufacturing (and
other) jobs in the United States, Canada and Europe started to be exported.
By 2007, it was estimatedthat the United States alone had exported 3 million full
time jobs to the emerging market economies. Further, Princeton economist Alan
Blinder, who served as vice chairman of the Federal Reserve during the Clinton
administration wrote a paper in 2007suggesting fully 30-40% of all jobs in the United States
could be “offshorable” in the next 10 to 20 years. This would equate to one out
of every three service sector jobs in America. (Note: Blinder was referring to services
that were “impersonally delivered” as it would be impossible to outsource
personally delivered service jobs such as taxi drivers or bartenders).
Wall Street Journal reporter
David Wessel wrote a wonderful article about the jobs lost to outsourcing in
2011 (link to the full story here) that included this very
telling graphic:
“in 2009, a recession year in which multinationals' sales and
capital spending fell, the companies cut 1.2 million, or 5.3%, of their workers
in the U.S. and 100,000, or 1.5%, of those abroad.”
From a cost-benefit standpoint
it makes sense for a profit maximizing business to cut back on its relatively higher
paid workers (from North America and Europe) first during slow economic times in
an effort to help improve their bottom lines.
As one would expect, the trend
towards outsourced labor contributed greatly to the rapid decline of the US
manufacturing base starting in the early 1990s - best shown in this chart on
the number of Manufacturing jobs in the US from the St. Louis Federal Reserve website
While the job losses tended to
accelerate during recessionary periods (as US companies looked to
‘cut the fat’) domestic
cutbacks continued during relatively calm economic times as well.
Contrary to the narrative from
corporations that outsourcing job losses were only affecting “low skilled” manufacturing
sectors, countries such as India & China (where English is taught in
schools) maintained an outstanding education system, and started producing
technically skilled laborers as well. As a result, these countries were turning
out highly qualified job candidates in the fields of engineering, medicine and information technology as
well.
Given the population
differential and the high cultural focus placed on education, both China and
India are now turning out more Honors students than the United Stateshas total students
enrolled in college. It follows then that the trend of highly educated and
skilled workers from China and India competing for jobs in the US, Canada and
Europe continues to this day.
From a corporate profitability standpoint,
the lower labor costs achieved via outsourcing were contributing directly to
corporate America’s vastly improving bottom line:
The increase in corporate
profits helped drive the US markets to all time record highs:
But for all of the positives achieved via
the move to outsource labor: consumer access to cheaper goods, increased
corporate profits and record high stock markets, there was a growing problem: middle
and lower income Americans were losing jobs at a staggering pace and struggling
to keep up with everyone else.
Not only were American’s losing jobs at a
staggering rate, but most of the employment opportunities that were available
paid significantly less than the jobs that had been lost due to outsourcing. So
most displaced workers who were lucky enough to find another job were not
making a wage comparable to the job that moved to China.
3. Job Loss, Standard of Living Trends and the
Utilization of Debt
“The losers will, of course, be those who become unemployed as a
result of production being moved to low-cost areas. There will also be those
who lose their jobs because their employers do not move offshore and are not
able to compete with cheap imported products. Finally, there will be those
whose earning capacity is reduced following the shift in the sharing of
value-added away from labor”.
Sir
James Goldsmith, “The Trap”
As discussed above, the
corporate shift towards outsourcing had a significant impact on the jobs market
in the United States. Millions of jobs were exported to the emerging markets of
China, India and the former Soviet Bloc (as well as other non-Japanese countries
such as Vietnam, Thailand and Cambodia) as companies sought to maximize profits
via wage arbitrage.
Due to the doubling of the
Global Labor pool and the corresponding excess supply of willing workers, there
was also pressure on wages to fall in advanced economies as well. As such, a
growing number of Americans who lost their jobs to outsourcing were unable to find new jobs at the same pay
scale.
Outsourcing had a significant impact
on standard of living trends both in the United States and the emerging markets
as well. While the direct benefactors of outsourcing (China for example) saw their
standard of living improve (as measured by real GDP growth), the relative standard
of living in the United States stayed mostly flat.
This suggests two key trends:1) The workers in China (and other countries
that were benefitting directly from the outsourcing trend) were enjoying a
newfound sense of wealth which was enabling consumers to make purchases that
they had never had access to before. People were moving out of the villages and
into the cities as demand for manufacturing jobs boomed and relative wages
& net wealth increased versus their Global counterparts.
2) The people of the United States (also applies to
Canada and Europe) were seeing their standard of living falling off in
comparison. This suggests that people were having a difficult time doing and
buying the same things that they had in previous years. Unfortunately rather
than reduce their expenditures to reflect these trends, Americans, Canadians
and Europeans supplemented their declining relative earnings by accumulating personal
debt (via the use of credit cards, lines of credit and home equity loans). As
you can see in the graph below, personal savings rates had been falling for
many years, but the assumption of debt (and erosion of savings) accelerated
significantly during the late 90s.
Part of the rise in debt
levels came from the well meaning but misguided economic policies adopted by US
Presidents Bill Clinton and George W. Bush. Both Presidents wanted to support
policies that would serve to maximize the number of Americans who owned their
own homes. President Bush spoke about transitioning America towards an “Ownership Society”.
The housing boom turned toxic
thanks to a confluence of unsustainable factors. These included the relaxing of
mortgage standards, consumer friendly mortgage products (such as Sub Prime,
“Ninja Loans” and AltA Mortgages) and an excessively promoted “pro-house
ownership” narrative pushed by the US government and main stream media.
All of these factors helped motivate scores of
people to pursue buying a home even though they couldn’t afford to buy one via traditional
standards (that is putting 20% down and assuming a mortgage with a 25 year
amortizations, etc). Unfortunately, the housing bubble burst in 2007 as housing
valuations (based on flimsy and false income declarations) were not sustainable
and prices fell substantially, leaving millions of Americansowing more on their
mortgage than their house was actually worth.
The bursting of the Housing Bubble
had a devastating impact on the Global markets. Unfortunately, mortgage debt
wasn’t the only problem. Many Americans (and Canadians) were also using various
forms of debt to finance day to day living expensesas well.
In addition to mortgages, many
consumers were accumulating ‘non-productive’ debt (debt that by its nature does
not offer an underlying capacity for wealth creation). This ‘non-productive debt’
became a burden that had to be serviced (through interest payments) but did not
contribute to a consumer’s financial well-being.
So, as more and more Americans
used debt to finance their day to day living, the precarious burden of debt
servicing grew as well. The wealthiest Americans however, did not have the same
problem. The accumulation of debt leads us to issue #4.
4. Income Inequality Gaps:
From 1983 to 2004, middle income
households saw their gross incomes increase by an average of one percent per
year. Meanwhile, the top 1% of income earners enjoyed a significantly higher rate
of growth on their income. The gap between the two incomes can be seen
diverging widely in the early 90’s, just as outsourcing started to become more
widely used by US multinational companies. There has been a tremendous amount
of valuable work on the subject of income inequality by Levy/Temin, Emmanuel Saez, & Saez/Piketty.
The graph below is
taken from a Congressional Budget Office report, and shows the growth in US income
inequality that started in the early 90s. The CBO was created by the US
government in 1974 to help them provide independent analysis of budgetary and
economic issues.
Obviously the wealthy not only
have higher incomes (earned via their positions as owners or executives of
companies), but they also tend to hold a larger proportion of financial assets
(stocks & bonds) relative to their middle and lower income earning
counterparts as well.
5. CEO and Executive Pay, Bonuses and Equity Based
Incentives:
As
discussed above, corporate profits as a percentage of GDP
soareddue to the profit margin improvements enjoyed by companies who
took advantage of the wage differentials in CIFSB (and Asia ex Japan) via outsourcing.
This enhanced profitability enabled CEOs, executives and board members to enjoy
significant increases in their pay, as compensation is closely linked to
corporate profitability.
While base salaries remained relatively
flat, total CEO & executive compensation reflected a growing trend towards
rewarding stock options and bonuses linked to corporate profitability.
“From 1978 to 2011,
CEO compensation increased more than 725 percent, a rise substantially greater
than stock market growth and the painfully slow 5.7 percent growth in worker
compensation over the same period.”
As discussed in note 3 above,
it is my theory that in an effort to offset their declining standard of living,
middle class Americans started to utilize credit facilities to supplement their
lifestyles. Consumers started saving less and borrowing more, optimistically
thinking that things would get better once
``the economy picked up again”.
Middle
and lower income earners in the US saw their savings collapse
And
their utilization of consumer debt explode
Since the increase in home
values was having a very large (positive) impact on US net worth. Many middle income
earners “felt” wealthier and in turn were using the equity in their homes as a
quick source of cash. Consumers were tapping into these reserves via “Home
equity based Lines of Credit” (HELOCs) to further finance their consumption,
even though the rates of consumption were significantly higher than their
incomes would support. Some in the financial industry referred to the trend as “using
your house as an ATM Machine”.
As
discussed previously, in an effort to offset the invisible impact of a
declining standard of living created by the doubling of the Global labor pool,
Americans whose savings were already depleted, were desperate to gain access to
credit products to drive their consumption desires. The voracious demand for access
to credit by consumers created an opportunity that led to my 7th category:
7. Wall Street Incentives
to create debt instruments and profit over clients:
Wall Street has always been
quick to fulfill demand for a product: be it an internet company, an initial
public offering, or some kind of securitized synthetic debt product. Over the
years, the issuance of various forms of consumer credit products has grown to become
became a very profitable business for the banks. But, as the market of qualified
people became saturated with ‘product’, it became necessary for the banks to
loosen lending standards, thereby expanding its offerings to a larger cohort within
the market: ‘the financially constrained’ individual.
Fulfilling the credit needs of
the ‘financially constrained’ was the inspiration behind a long list of now
infamous products such as Sub Prime Mortgages, AltA mortgages, No Money Down mortgages, “Ninja” Loans, credit cards
(with teaser rates) and Home equity based lines of credit (HELOCs). These are
all prime examples of credit products created by the financial industry specifically
designed for consumers who had less than stellar credit scores. By
expanding these credit facilities and making these products available to the
general public, Wall Street enabled consumers to borrow money beyond their
means so they could keep spending and consuming. This access to additional credit
drove consumption higher, which in turn propelled the economy forward.
In addition to creating exotic
consumer credit products, Wall Street had also developed a very large securitization business. Here, Wall Street
purchased pools of loans from the banks (mortgages, auto loans, etc) in order
to create pooled funds. These funds would be rated via a debt rating agency
such as Standard and Poors or Moodys and then resold to investors as a kind of
‘bond/debt fund’. The appetite for this ‘riskless’ investment (as some of these
pools were rated AAA) by institutional investors was voracious, and in turn created
a positive feedback loop whereby more exotic (and risky) loans were needed in
order to create more pools to sell.
Wall Street was more than happy
to oblige, even though privately they were already starting to
see problems arising. The Financial Crisis of 2008 started when the flaws in
these highly rated investment pools finally started to appear and the true
nature of their high risk profiles became more apparent.
At this point in the housing
& market bubble Wall Street abandoned its fiduciary duty to the client in
favor of profits and bonuses. Conflicts of interest became the norm, and the
system finally collapsed on itself and became a crisis. The result: the Financial
Crisis of 2008, served as a catalyst for my final investment component for this
discussion paper: “Peak Debt”.
8. Peak Debt and the
start of the Great Deleveraging:
“Debt is future consumption denied”
Eugen
Bohm von Bawerk
“Peak Debt” was a term coined
in 2006 by Jaswant Jain, PhD in 2006. Jain concluded that debt taken on by a
consumer will rise until it hits an exhaustion point. Once this point is
reached, current income flows can no longer support debt servicing costs. As
such, consumption must be reduced so that the consumer can begin paying down his
or her debts. This process of reducing debt loads is called “deleveraging”. While
this action makes sense for an individual to follow, if too many people stop
consuming at the same time the economy would be negatively impacted and a
recession would follow (or a recession would expand into a larger, more
significant “depression”). Economists refer to this unique situation as
“The
paradox states that if everyone tries to save more money during times of
economic recession, then aggregate demand will fall and will in turn lower
total savings in the population because of the decrease in consumption and economic
growth. The paradox is, narrowly speaking, that total savings may fall even
when individual savings attempt to rise, and, broadly speaking, that increase
in savings may be harmful to an economy.[4] Both the narrow and broad claims
are paradoxical within the assumption underlying the fallacy of composition,
namely that what is true of the parts must be true of the whole. The narrow
claim transparently contradicts this assumption, and the broad one does so by
implication, because while individual thrift is generally averred to be good
for the economy, the paradox of thrift holds that collective thrift may be bad
for the economy.”
So, when the housing bubble
finally burst in 2007, in addition to all of the damage done to the Bank’s
balance sheets (due excessive leverage and impaired investments) consumers were
no longer able
to utilize their home equity
to finance additional consumption. Instead, consumers now had to reverse course
and withhold new purchases in favor
of paying down their debts. In some cases, people had to take the ultimate step
and declare bankruptcy, thereby writing off the debt completely. The
combination of the collapse on Wall Street along with the decline in consumer
expenditures resulted in a very large recession in the United States.
In response to these
deflationary economic pressures, the Federal Reserve (FED) implemented a program
called “Quantitative Easing” that specifically attempted to reflate asset
prices. While the program has been reasonably successful in reflating the stock
market back to all time highs, it has not been as successful in sparking a
recovery in the underlying US economy. As such, US GDP and job growth continue sputter
sporadically at levels that are well below the historical average at this point
in a ‘recovery’. I put quotations around
the term “recovery” as I have discussed above, for many people the recession of
2009 never really ended. References to this
can be found here, here and here.
The
Dilemma:
Unlike governments, consumers
can not consistently spend beyond their means forever. When a consumer
purchases a good by assuming a debt, they effectively pull demand forward at
the expense of demand they will have in the future
(as the debt assumed today needs to be repaid tomorrow). It follows then that
when consumption and economic growth rates are higher than wage growth over a
prolonged period, the situation is unsustainable and will have to readjust at
some future point.
The graph below shows the progress
of household incomes, economic growth and consumption in the US from 1990-2013.
Clearly consumption and economic growth have outpaced income growth by a wide
margin, and therefore it is only natural for us to expect some form of readjustment
to a lower and more sustainable level. Alternatively, income levels could
increase to better match consumption, but as this paper has shown, this is
unlikely to happen.
Optimistic narratives relating
to “better times ahead” are focused solely on the metric of a rising stock
market and completely ignore the unaddressed economic problems that continue
exist under the surface. Consider this statistic: As of March 31st
2014, the median size of a 401(k) (the US equivalent to an RSP account) is
$24,400, and for people older than 55, it is $65,300. Plainly put, consumers
have spent beyond their means for too long, and are now deleveraging their
balance sheets. Wide spread deleveraging of this nature is NOT conducive to
economic growth.
By failing to recognize these
facts, the Central Banks have arrived at faulty conclusions which have led them
to employ ineffective remedies. These remedies are clearly not working and instead
could be creating the catalyst for another more damaging crisis in the future.
What
to expect going forward:
“I
suppose it is tempting, if the only tool you have is a hammer, to treat
everything as if it were a nail”
Abraham Maslow
The Federal Reserve has made
it clear that they are going to continue to keep monetary policy extremely
accommodative until such a time as the economy is firmly back on solid footing.
Part of their strategy involves supporting the stock market in the hopes that a
trickle down `wealth effect` occurs. Unfortunately, a closer look at how a ‘wealth
effect’ impacts the economy suggests that the contribution is marginal at
best. For those interested, Dr. Lacy
Hunt from Hoisington Management wrote a very strong piece discussing the
ineffectiveness of wealth effects on the greater economy here:
Given wealth effects don’t
work, investors should expect to see a widening gap between stock market
valuations and the underlying economy. This is concerning given stock
valuations are lofty by almost any metric one cares to use. Robert Shiller, who
recently won the Nobel Prize in Economics for his work on identifying asset bubbles
has data
showing US stocks have only been as expensive as they are today three times in the last century.
The previous dates will be very noteworthy to investors: the late 1920s, early 2000 and the prelude to
the 2007 financial crisis.
Despite calls to the contrary,
I believe interest rates will stay low for an extended period of time. Higher interest
rates reflect inflationary pressures created via robust economic growth and as
I’ve shown in the information above, the US economy mired
in severe structural problems that are creating deflationary forces. As such,
interest rates will rise only when these structural problems are finally
resolved.
It is my sense that the stock market
will continue to try and gravitate towards higher levels even as earnings expectations
and economic growth forecasts fall short of expectations. With valuations at
elevated levels and risk being suppressed by ‘artificial means’ through Fed
policy, investors need to be very cautious about their overall investment
strategies and asset allocations. It would be wise for all investors to take a
very close look at their risk exposures given the issues mentioned above.