|
| How does this 2 day rally compare to the historical average? |
I had already been running a bit of numbers in response to the "Bullard rally" in October, so I tweaked things a bit to see if I could see the context of the Dec 16-18 move relative to other big rallies in the S&P 500 throughout history.
Now, a huge warning about this post and its findings - I do NOT have a Bloomberg terminal, so all of the data crunching I've done here has been by hand. Exporting the daily pricing data into an excel spreadsheet, calculating the 2 day returns, ranking them - etc. It's been fun, but there may be bone headed errors, even though I've tried my best to be as accurate as possible.
After ranking all of the 2 day rallies going back as far as I could (1928) - I found the Great Depression was providing way too much noise. So I thought I'd look at the data from January 2nd, 1940 to December 2014.
When I did that, some interesting things happened.
A - I found that the 4.49% rally we saw from December 16th to 18th was indeed noteworthy as it ranked as the 89th largest rally out of 18,853 2 day rallies in the data set. Not bad given a three sigma move is 5.05%.
B - I also noticed a tremendous cluster of similar dates on the other top rallies - 2008, 2000, 1998, 1973, 1982, etc
So, after ranking the top 100 2 day rallies back to 1940, I was able to categorize them into the following 12 events -
1. The 1987 Crash (Oct 19th, 1987)
2. The Sub-Prime Crisis
3. The Dot.com bubble
4. The 1973 - 1975 Recession
5. The 1981-82 Recession
6. The European Crisis of 2011
7. The 1990-91 Recession
8. The 1969-70 Recession
9. The Asian Flu
10. The LTCM Crisis
11. Various dates associated with war outbreaks
12. an "Unknown" classification - requires more research on the significance of each day
The date ranges I used for each particular crisis or event was the relative high as the start date, and the low as the end date. I did strip out the high market value reached before the Great Depression because the 31.86 high reached in 1929 wasn't recovered until 1954.
Doing this resulted in the following breakdown -

So, apart from the 14 days listed in the "unknown" category (which is more a function of me needing to do a bit more research than anything else) and the Dec 16-18th rally, 85% of the 2 day rallies between January 1940 and December 2014 occurred during a time of financial crisis, bubble chaos, recession or time of war. I found that very striking given the December 16-18th rally happened absent any of those markers.
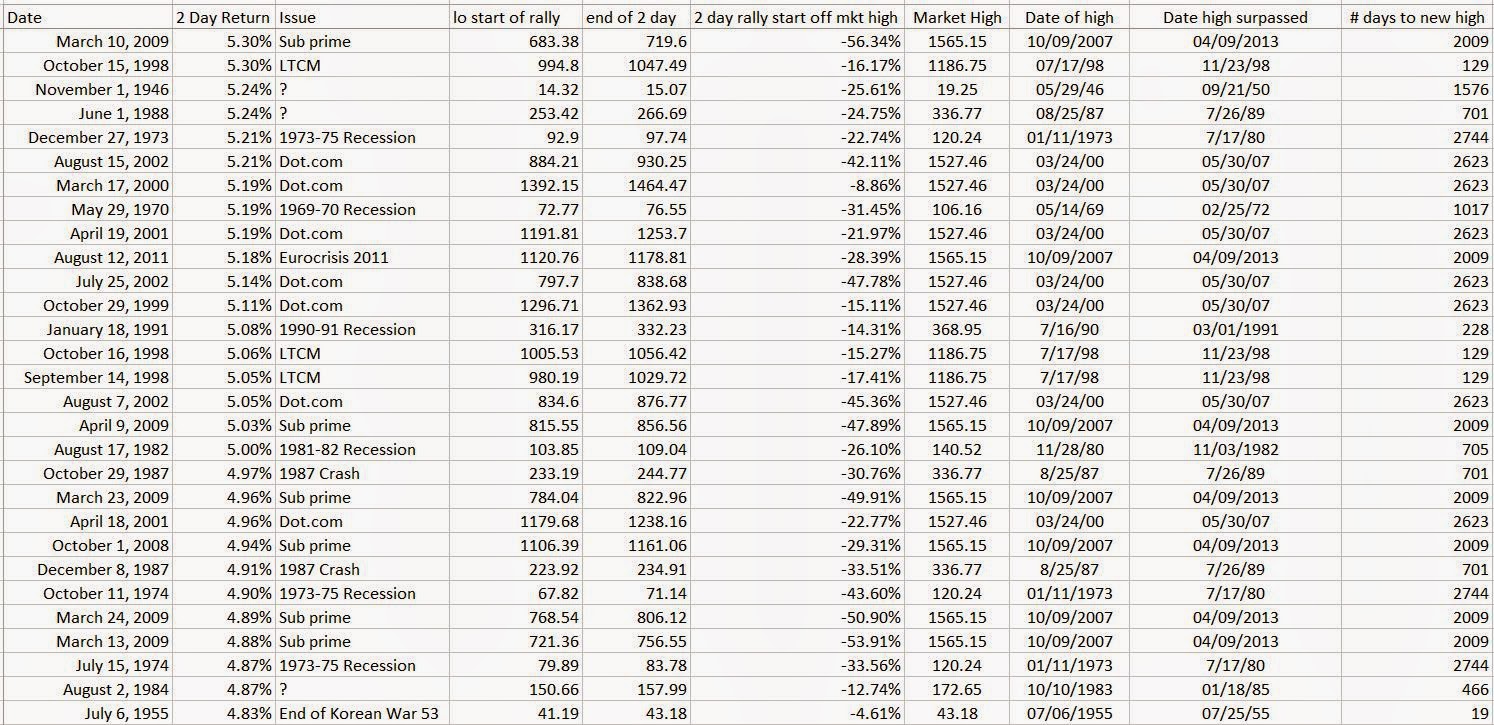
The other question I had about the history or tendencies of huge 2 day rallies related to how they compared to the previous high. My guess was that many (or most) of these unusually large 2 day rallies would occur after a significant correction or pullback from a previous high. SO once again I did a bit of digging through the data.
I found the larger (ie top 100 2 day rallies) occurred only after the markets had corrected on average by 30%. The smallest correction (3.59%) and outlier 2 day rally of 5.46% occurred in November 1982, during the 1980-81 recession. But, it took 705 days to surge past the previous market high. The December 16-18 4.49% rally occurred after a 4.95% correction but only took 7 days to surpass the previous record high. This is unusual given the average number of days to surpass the previous record high is 1637 days.
While this breakdown doesn't provide any information that will help you with a trade, it does put the December 16-18 2 day rally of 4.49% into context. Given the rally occurred absent a recession, crisis, bubble or time of war - the magnitude of the rise is VERY unusual and should not be treated as 'normal' or "not noteworthy" -
A breakdown of the top 100 2 day rallies is snapped below for your interest - again, given this was all done by hand, there may indeed be some errors.. but I've tried to be as thorough as possible. If you notice an error please let me know and I will update my spreadsheet. Or, if you are able to track down any of the "unknown" events let me know..


If you find this information useful GREAT!! If you reproduce it, post it, etc.. please do me a favor and provide attribution. I don't post much but it would be nice to get some credit if you find the material interesting.
Thx